Ch 11 — Gearing Up with Support Utilities
Gearing Up with Support Utilities In the previous chapter, we learned the basics of Low-Level Virtual Machine (LLVM) intermediate representation (IR)—the target-independent intermediate representations in LLVM—and how to inspect and manipulate this with C++ application programming interfaces (APIs). These are the core techniques for doing program analysis and transformation in LLVM. In addition to those skill sets, LLVM also provides many support utilities to improve compiler developers' productivity when working with LLVM IR. We are going to cover those topics in this chapter. A compiler is a complex piece of software. It not only needs to handle thousands of different cases— including input programs with different shapes and a wide variety of target architectures—but the correctness of a compiler is also an important topic: namely, the compiled code needs to have the same behavior as the original one. LLVM, a largescale compiler framework (and probably one of the biggest), is not an exception.
256 Gearing Up with Support Utilities
To tackle these complexities, LLVM has provided a crate of gadgets to improve the development experience. In this chapter, we are going to show you how to gear up to use those tools. The utilities covered here can assist you in diagnosing problems that occur from the LLVM code you are developing. This includes more efficient debugging, error handling, and profiling abilities; for instance, one of the tools can collect statistical numbers on key components—such as the number of basic blocks being processed by a specific Pass—and automatically generate a summary report. Another example is LLVM's own error-handling framework, which prevents as many unhandled errors (a common programming mistake) as possible. Here is a list of the topics we are going to cover in this chapter:
• Printing diagnostic messages • Collecting statistics • Adding time measurements • Error-handling utilities in LLVM • Learning about the Expected and ErrorOr classes
With the help of these utilities, you will have a better time debugging and diagnosing the LLVM code, letting you focus on the core logic you want to implement with LLVM.
Technical requirements In this section, we are also going to use LLVM Pass as the platform to show different API usages. Therefore, please make sure you have built the opt command-line tool, as follows:
$ ninja opt
Note that some of the content in this chapter only works with a debug build version of LLVM. Please check the first chapter, Chapter 1, Saving Resources When Building LLVM, for a recap on how to build LLVM in debug mode. You can also go back to Chapter 9, Working with PassManager and AnalysisManager, if you are not sure how to create a new LLVM Pass. The sample code for this chapter can be found here: https://github.com/PacktPublishing/LLVM-Techniques-Tips-andBest-Practices-Clang-and-Middle-End-Libraries/tree/main/ Chapter11
Printing diagnostic messages 257
Printing diagnostic messages In software development, there are many ways to diagnose a bug—for instance, using a debugger, inserting a sanitizer into your program (to catch invalid memory access, for example), or simply using one of the simplest yet most effective ways: adding print statements. While the last option doesn't sound really smart, it is actually pretty useful in many cases where other options cannot unleash their full potential (for example, release mode binaries with poor debug information quality or multithread programs). LLVM provides a small utility that not only helps you to print out debug messages but also filters which messages to show. Let's say we have an LLVM Pass, SimpleMulOpt, which replaces multiplication by power-of-two constants with left-shifting operations (which is what we did in the last section of the previous chapter, Processing LLVM IR). Here is part of its run method:
  PreservedAnalyses
  SimpleMulOpt::run(Function &F, FunctionAnalysisManager &FAM) {
    for (auto &I : instructions(F)) {
      if (auto *BinOp = dyn_cast<BinaryOperator>(&I) &&
          BinOp->getOpcode() == Instruction::Mul) {
        auto *LHS = BinOp->getOperand(0),
             *RHS = BinOp->getOperand(1);
        // `BinOp` is a multiplication, `LHS` and `RHS` are its
        // operands, now trying to optimize this instruction…
The preceding code iterates through all instructions in the given function before looking for instructions that represent arithmetic multiplication. If there are any, the Pass will then work with the LHS and RHS operands (which appear in the rest of the code—these are not shown here).
258 Gearing Up with Support Utilities
Let's assume that we want to print out the operand variables during our development. The most naïve way will be by using our old friend errs(), which streams arbitrary messages to stderr, as shown in the following code snippet:
// (extracted from the previous snippet) auto *LHS = BinOp->getOperand(0), *RHS = BinOp->getOperand(1); errs() << "Found a multiplication with operands "; LHS->printAsOperand(errs()); errs() << " and "; RHS->printAsOperand(errs());
The printAsOperand used in the preceding code snippet prints the textual representation of a Value to the given stream (errs(), in this case). Everything looks normal, except the fact that these messages will be printed out anyway even in a production environment, which is not what we want. Either we need to remove these codes before we ship our products, adding some macro guard around these codes (for example, #ifndef NDEBUG), or we can use the debug utility provided by LLVM. Here is an example of this:
#include "llvm/Support/Debug.h" #define DEBUG_TYPE "simple-mul-opt" auto *LHS = BinOp->getOperand(0), *RHS = BinOp->getOperand(1); LLVM_DEBUG(dbgs() << "Found a multiplication with operands "); LLVM_DEBUG(LHS->printAsOperand(dbgs())); LLVM_DEBUG(dbgs() << " and "); LLVM_DEBUG(RHS->printAsOperand(dbgs()));
Printing diagnostic messages 259
The preceding code is basically doing the following three things:
   • Replacing any usage of errs() with dbgs(). These two streams are basically
     doing the same thing, but the latter one will add a nice banner (Debug Log
     Output) to the output message.
   • Wrapping all lines related to debug printing with the LLVM_DEBUG(…) macro
     function. The use of this macro ensures that the enclosing line is only compiled
     in development mode. It also encodes the debug message category, which we will
     introduce shortly.
   • Before using any LLVM_DEBUG(…) macro functions, please make sure you
     define DEBUG_TYPE to the desired debug category string (simple-mul-opt,
     in this case).
In addition to the aforementioned code modification, we also need to use an additional command-line flag, -debug, with opt to print those debug messages. Here is an example of this:
$ opt -O3 -debug -load-pass-plugin=… …
But then, you'll find the output to be pretty noisy. There are tons of debug messages from other LLVM Passes. In this case, we're only interested in the messages from our Pass. To filter out unrelated messages, we can use the -debug-only command-line flag. Here is an example of this:
$ opt -O3 -debug-only=simple-mul-opt -load-pass-plugin=… …
The value after -debug-only is the DEBUG_TYPE value we defined in the previous code snippet. In other words, we can use DEBUG_TYPE defined by each Pass to filter the desired debug messages. We can also select multiple debug categories to print. For instance, check out the following command:
$ opt -O3 -debug-only=sroa,simple-mul-opt -load-pass-plugin=… …
This command not only prints debug messages from our SimpleMulOpt Pass, but also those coming from the SROA Pass—an LLVM Pass included in the O3 optimization pipeline.
260 Gearing Up with Support Utilities
In addition to defining a single debug category (DEBUG_TYPE) for an LLVM Pass, you are in fact free to use as many categories as you like inside a Pass. This is useful, for instance, when you want to use separate debug categories for different parts of a Pass. For example, we can use separate categories for each of the operands in our SimpleMulOpt Pass. Here is how we can do this:
#define DEBUG_TYPE "simple-mul-opt" auto *LHS = BinOp->getOperand(0), *RHS = BinOp->getOperand(1); LLVM_DEBUG(dbgs() << "Found a multiplication instruction"); DEBUG_WITH_TYPE("simple-mul-opt-lhs", LHS->printAsOperand(dbgs() << "LHS operand: ")); DEBUG_WITH_TYPE("simple-mul-opt-rhs", RHS->printAsOperand(dbgs() << "RHS operand: "));
DEBUG_WITH_TYPE is a special version of LLVM_DEBUG. It executes code at the second argument, with the first argument as the debug category, which can be different from the currently defined DEBUG_TYPE value. In the preceding code snippet, in addition to printing Found a multiplication instruction using the original simplemul-opt category, we are using simple-mul-opt-lhs to print messages related to the left-hand-side (LHS) operand and use simple-mul-opt-rhs to print messages for the other operand. With this feature, we can have a finer granularity to select debug message categories via the opt command. You have now learned how to use the utility provided by LLVM to print out debug messages in the development environment only, and how to filter them if needed. In the next section, we are going to learn how to collect key statistics while running an LLVM Pass.
Collecting statistics As mentioned in the previous section, a compiler is a complex piece of software. Collecting statistical numbers—for example, the number of basic blocks processed by a specific optimization—is one of the easiest and most efficient ways to get a quick portrait on the runtime behaviors of a compiler.
Collecting statistics 261
There are several ways to collect statistics in LLVM. In this section, we are going to learn three of the most common and useful options for doing this, and these methods are outlined here:
• Using the Statistic class • Using an optimization remark • Adding time measurements
The first option is a general utility that collects statistics via simple counters; the second option is specifically designed to profile compiler optimizations; and the last option is used for collecting timing information in the compiler. Let's start with the first one.
Using the Statistic class In this section, we are going to demonstrate new features by amending them to the SimpleMulOpt LLVM Pass from the previous section. First, let's assume that we don't only want to print out the operand Value from multiplication instructions but that we also want to count how many multiplication instructions have been processed by our Pass. First, let's try to implement this feature using the LLVM_DEBUG infrastructure we just learned about, as follows:
  #define DEBUG_TYPE "simple-mul-opt"
  PreservedAnalyses
  SimpleMulOpt::run(Function &F, FunctionAnalysisManager &FAM) {
    unsigned NumMul = 0;
    for (auto &I : instructions(F)) {
      if (auto *BinOp = dyn_cast<BinaryOperator>(&I) &&
          BinOp->getOpcode() == Instruction::Mul) {
        ++NumMul;
    LLVM_DEBUG(dbgs() << "Number of multiplication: " << NumMul);
262 Gearing Up with Support Utilities
This approach seems pretty straightforward. But it comes with a drawback—the statistical numbers we are interested in are mixed with other debug messages. We need to take additional actions to parse or filter the value we want because although you might argue that these problems could be tackled by using a separate DEBUG_TYPE tag for each counter variable, when the number of counter variables increases, you might find yourself creating lots of redundant code. One elegant solution is to use the Statistic class (and related utilities) provided by LLVM. Here is a version rewritten using this solution:
  #include "llvm/ADT/Statistic.h"
  #define DEBUG_TYPE "simple-mul-opt"
  STATISTIC(NumMul, "Number of multiplications processed");
  PreservedAnalyses
  SimpleMulOpt::run(Function &F, FunctionAnalysisManager &FAM) {
    for (auto &I : instructions(F)) {
      if (auto *BinOp = dyn_cast<BinaryOperator>(&I) &&
          BinOp->getOpcode() == Instruction::Mul) {
        ++NumMul;
The preceding code snippet shows the usage of Statistic, calling the STATISTIC macro function to create a Statistic type variable (with a textual description) and simply using it like a normal integer counter variable. This solution only needs to modify a few lines in the original code, plus it collects all counter values and prints them in a table view at the end of the optimization. For example, if you run the SimpleMulOpt Pass using the -stats flag with opt, you will get the following output:
$ opt -stats –load-pass-plugin=… … ===-------------------------------=== … Statistics Collected … ===-------------------------------=== 87 simple-mul-opt - Number of multiplications processed $
Collecting statistics 263
87 is the number of multiplication instructions processed in SimpleMulOpt. Of course, you are free to add as many Statistic counters as you want in order to collect different statistics. If you run more than one Pass in the pipeline, all of the statistical numbers will be presented in the same table. For instance, if we add another Statistic counter into SimpleMulOpt to collect a number of none-power-of-two constant operands from the multiplication instructions and run the Pass with Scalar Replacement of Aggregates (SROA), we can get an output similar to the one shown next:
$ opt -stats –load-pass-plugin=… --passes="sroa,simple-multopt" … ===-------------------------------=== … Statistics Collected … ===-------------------------------=== 94 simple-mul-opt - Number of multiplications processed 87 simple-mul-opt - Number of none-power-of-two constant operands 100 sroa - Number of alloca partition uses rewritten 34 sroa - Number of instructions deleted $
The second column in the preceding code snippet is the name of the origin Pass, which is designated by the DEBUG_TYPE value defined prior to any calls to STATISTIC. Alternatively, you can output the result in JavaScript Object Notation (JSON) format by adding the -stats-json flag to opt. For example, look at the following code snippet:
$ opt -stats -stats-json –load-pass-plugin=… … { "simple-mul-opt.NumMul": 87 $
264 Gearing Up with Support Utilities
In this JSON format, instead of printing statistic values with a textual description, the field name of a statistic entry has this format: "<Pass name>.<Statistic variable name>" (the Pass name here is also the value of DEBUG_TYPE). Furthermore, you can print statistic results (either in default or JSON format) into a file using the -infooutput-file=<file name> command-line option. The following code snippet shows an example of this:
$ opt -stats -stats-json -info-output-file=my_stats.json … $ cat my_stats.json { "simple-mul-opt.NumMul": 87 $
You have now learned how to collect simple statistic values using the Statistic class. In the next section, we are going to learn a statistic collecting method that is unique to compiler optimization.
Using an optimization remark A typical compiler optimization usually consists of two stages: searching for the desired patterns from the input code, followed by modifying the code. Take our SimpleMulOpt Pass as an example: the first stage is to look for multiplication instructions (BinaryOperator with the Instruction::Mul operation code (opcode)) with power-of-two constant operands. For the second stage, we create new left-shifting instructions via IRBuilder::CreateShl(…) and replace all old usages of multiplication instructions with these. There are many cases, however, where the optimization algorithm simply "bails out" during the first stage due to infeasible input code. For example, in SimpleMulOpt, we are looking for a multiplication instruction, but if the incoming instruction is not BinaryOperator, the Pass will not proceed to the second stage (and continue on to the next instruction). Sometimes, we want to know the reason behind this bailout, which can help us to improve the optimization algorithm or diagnose incorrect/suboptimal compiler optimization. LLVM provides a nice utility called an optimization remarks to collect and report this kind of bailout (or any kind of information) occurring in optimization Passes. For example, let's assume we have the following input code:
  int foo(int *a, int N) {
    int x = a[5];
    for (int i = 0; i < N; i += 3) {
Collecting statistics 265
       a[i] += 2;
       x = a[5];
      return x;
Theoretically, we can use loop-invariant code motion (LICM) to optimize this code into an equivalent code base such as this one:
  int foo(int *a, int N) {
    for (int i = 0; i < N; i += 3) {
      a[i] += 2;
    return a[5];
We can do this as the fifth array element, a[5], never changed its value inside the loop. However, if we run LLVM's LICM Pass over the original code, it fails to perform the expected optimization. To diagnose this problem, we can invoke the opt command with an additional option: --pass-remarks-output=<filename>. The filename will be a YAML Ain't Markup Language (YAML) file in which optimization remarks print out the possible reasons why LICM failed to optimize. Here is an example of this:
$ opt -licm input.ll –pass-remarks-output=licm_remarks.yaml … $ cat licm_remarks.yaml --- !Missed Pass: licm Name: LoadWithLoopInvariantAddressInvalidated Function: foo Args: - String: failed to move load with loop-invariant address because the loop may invalidate its value $
266 Gearing Up with Support Utilities
The cat command in the preceding output shows one of the optimization remark entries in licm_remarks.yaml. This entry tells us that there was a missed optimization that happened in the LICM Pass when it was processing the foo function. It also tells us the reason: LICM was not sure if a particular memory address was invalidated by the loop. Though this message doesn't provide fine-grained details, we can still infer that the problematic memory address concerning LICM was probably a[5]. LICM was not sure if the a[i] += 2 statement modified the content of a[5]. With this knowledge, compiler developers can get hands-on in improving LICM—for example, teaching LICM to recognize induction variables (that is, the i variable in this loop) with a step value greater than 1 (in this case, it was 3, since i += 3). To generate optimization remarks such as the one shown in the preceding output, compiler developers need to integrate a specific utility API into their optimization Pass. To show you how to do that in your own Pass, we are going to reuse our SimpleMulOpt Pass as the sample. Here is part of the code that performs the first stage—searching for multiplications with power-of-two constant operands—in SimpleMulOpt:
  for (auto &I : instructions(F)) {
    if (auto *BinOp = dyn_cast<BinaryOperator>(&I))
      if (BinOp->getOpcode() == Instruction::Mul) {
        auto *LHS = BinOp->getOperand(0),
             *RHS = BinOp->getOperand(1);
        // Has no constant operand
        if (!isa<Constant>(RHS)) continue;
        const APInt &Const = cast<ConstantInt>(RHS)->getValue();
        // Constant operand is not power of two
        if (!Const.isPowerOf2()) continue;
The preceding code checks if the operand is constant before making sure it's also a powerof-two operand. If either of these checks fails, the algorithm will bail out by continuing on to the next instruction in the function.
Collecting statistics 267
We intentionally inserted a small flaw into this code to make it less powerful, and we are going to show you how to find that problem by using an optimization remark. Here are the steps to do this:
  1. First, we need to have an OptimizationRemarkEmitter instance, which can
     help you to emit remark messages. This can be obtained from its parent analyzer,
     OptimizationRemarkEmitterAnalysis. Here is how we include it at the
     beginning of the SimpleMulOpt::run method:
         #include "llvm/Analysis/OptimizationRemarkEmitter.h"
         PreservedAnalyses
         SimpleMulOpt::run(Function &F, FunctionAnalysisManager
         &FAM) {
           OptimizationRemarkEmitter &ORE
             = FAM.getResult<OptimizationRemarkEmitterAnalysis>(F);
  2. Then, we are going to use this OptimizationRemarkEmitter instance to emit
     an optimization remark if the multiplication instruction lacks a constant operand,
     as follows:
         #include "llvm/IR/DiagnosticInfo.h"
         if (auto *BinOp = dyn_cast<BinaryOperator>(&I))
           if (BinOp->getOpcode() == Instruction::Mul) {
             auto *LHS = BinOp->getOperand(0),
                  *RHS = BinOp->getOperand(1);
             // Has no constant operand
             if (!isa<ConstantInt>(RHS)) {
               std::string InstStr;
               raw_string_ostream SS(InstStr);
               I.print(SS);
               ORE.emit([&]() {
                 return OptimizationRemarkMissed(DEBUG_TYPE,
                                             "NoConstOperand", &F)
                        << "Instruction" <<
                        << ore::NV("Inst", SS.str())
                        << " does not have any constant operand";
268 Gearing Up with Support Utilities
                     });
                     continue;
      There are several things to be noticed here, as follows:
  • The OptimizationRemarkEmitter::emit method takes a lambda function
    as the argument. This lambda function will be invoked to emit an optimization
    remark object if the optimization remark feature is turned on (via the –pass-
    remarks-output command-line option we've seen previously, for example).
  • The OptimizationRemarkMissed class (note that it is not declared in
    OptimizationRemarkEmitter.h but in the DiagnosticInfo.h header
    file) represents the remark of a missed optimization opportunity. In this case,
    the missed opportunity is the fact that instruction I does not have any constant
    operand. The constructor of OptimizationRemarkMissed takes three
    arguments: the name of the Pass, the name of the missed optimization opportunity,
    and the enclosing IR unit (in this case, we use the enclosing Function). In
    addition to constructing a OptimizationRemarkMissed object, we also
    concatenate several objects via the stream operator (<<) at the tail. These objects
    will eventually be put under the Args section of each optimization remark entry in
    the YAML file we saw previously.
      In addition to using OptimizationRemarkMissed to notify you of
      missed optimization opportunities, you can also use other classes derived
      from DiagnosticInfoOptimizationBase to present different
      kinds of information—for example, use OptimizationRemark
      to find out which optimization has been successfully applied, and use
      OptimizationRemarkAnalysis to keep a log of analysis data/facts.
  • Among objects concatenated by the stream operator, ore::NV(…) seems to be
    a special case. Recall that in the optimization remark YAML file, each line under
    the Args section was a key-value pair (for example, String: failed to
    move load with…., where String was the key). The ore::NV object allows
    you to customize the key-value pair. In this case, we are using Inst as the key
    and SS.str() as the value. This feature provides more flexibility to parse the
    optimization remark YAML file—for instance, if you want to write a little tool to
    visualize the optimization remarks, custom Args keys can give you an easier time
    (during the parsing stage) by distinguishing critical data from other strings.
Collecting statistics 269
3. Now that you have inserted the code to emit the optimization remark, it's time to
   test it. This time, we are going to use the following IR function as the input code:
       define i32 @bar(i32 %0) {
         %2 = mul nsw i32 %0, 3
         %3 = mul nsw i32 8, %3
         ret %3
    You can rebuild the SimpleMulOpt Pass and run it using a command such as this:
       $ opt –load-pass-plugin=… –passes="simple-mul-opt" \
             –pass-remarks-output=remark.yaml -disable-output
              input.ll
       $ cat remark.yaml
       --- !Missed
       Pass:             simple-mul-opt
       Name:            NoConstOperand
       Function:         bar
       Args:
         - String:           'Instruction'
         - Inst:             ' %3 = mul nsw i32 8, %3'
         - String:           ' does not contain any constant
       operand'
       $
    From this optimization remark entry, we can glean that SimpleMulOpt bailed
    out because it couldn't find a constant operand on one of the (multiplication)
    instructions. The Args section shows a detailed reason for this.
    With this information, we realize that SimpleMulOpt is unable to optimize a
    multiplication whose first operand (LHS operand) is a power-of-two constant, albeit
    a proper optimization opportunity. Thus, we can now fix the implementation of
    SimpleMulOpt to check if either of the operands is constant, as follows:
       if (BinOp->getOpcode() == Instruction::Mul) {
         auto *LHS = BinOp->getOperand(0),
              *RHS = BinOp->getOperand(1);
         // Has no constant operand
270 Gearing Up with Support Utilities
             if (!isa<ConstantInt>(RHS) && !isa<ConstantInt>(LHS)) {
               ORE.emit([&]() {
                 return …
               });
               continue;
You have now learned how to emit optimization remarks in an LLVM Pass and how to use the generated report to discover potential optimization opportunities. So far, we have only studied the generated optimization remark YAML file. Though it has provided valuable diagnostic information, it would be great if we could have more fine-grained and intuitive location information to know where exactly these remarks happened. Luckily, Clang and LLVM have provided a way to achieve that. With the help of Clang, we can actually generate optimization remarks with source location (that is, line and column numbers in the original source file) attached. Furthermore, LLVM provides you with a small utility that can associate an optimization remark with its corresponding source location and visualize the result on a web page. Here's how to do this:
  1. Let's reuse the following code as the input:
         int foo(int *a, int N) {
           for (int i = 0; i < N; i += 3) {
             a[i] += 2;
           return a[5];
      First, let's generate optimization remarks using this clang command:
         $ clang -O3 -foptimization-record-file=licm.remark.yaml \
                 -S opt_remark_licm.c
      Though we're using a different name, -foptimization-record-file is the
      command-line option used to generate an optimization remark file with the given
      filename.
Collecting statistics 271
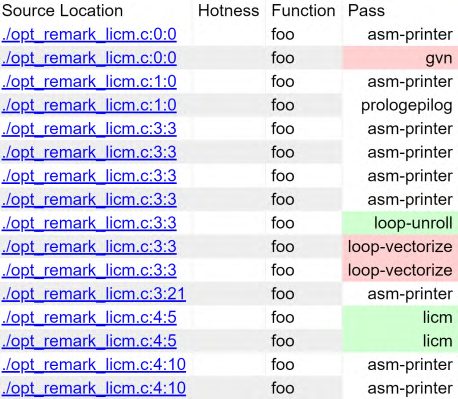
2. After licm.remark.yaml is generated, let's use a utility called opt-viewer.py to visualize the remarks. The opt-viewer.py script is not installed in the typical location by default—instead of putting it in <install path>/bin (for example /usr/bin), it is installed in <install path>/share/opt-viewer (/usr/ share/opt-viewer). We are going to invoke this script with the following command-line options: $ opt-viewer.py --source-dir=$PWD \ --target-dir=licm_remark licm.remark.yaml
(Note that opt-viewer.py depends on several Python packages such as pyyaml and pygments. Please install them before you use opt-viewer.py.) 3. There will be a HTML file—index.html—generated inside the licm_remark folder. Before you open the web page, please copy the original source code—opt_ remark_licm.c—into that folder as well. After that, you will be able to see a web page like this:
Figure 11.1 – Web page of optimization remarks combined with the source file We are particularly interested in two of these columns: Source Location and Pass. The latter column shows the name of the Pass and the type of the optimization remark—Missed, Passed, or Analyzed rendered in red, green, and white, respectively—attached on a given line shown at the Source Location column.
272 Gearing Up with Support Utilities
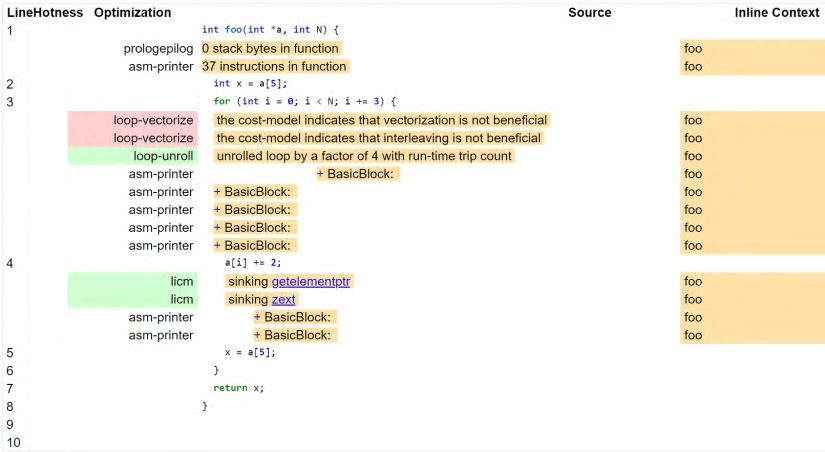
      If we click on a link in the Source Location column, this will navigate you to a page
      that looks like this:
                          Figure 11.2 – Details of an optimization remark
      This page gives you a nice view of optimization remark details, interleaved with the
      originating source code line. For example, on line 3, loop-vectorize Pass said
      it couldn't vectorize this loop because its cost model didn't think it was beneficial
      to do so.
You have now learned how to use optimization remarks to gain insights into the
optimization Pass, which is especially useful when you're debugging a missing
optimization opportunity or fixing a mis-compilation bug.
In the next section, we are going to learn some useful skills to profile the execution time
of LLVM.
Adding time measurements LLVM is an enormous software, with hundreds of components working closely together. Its ever-increasing running time is slowly becoming an issue. This affects many use cases that are sensitive to compilation time—for example, the Just-in-Time (JIT) compiler. To diagnose this problem in a systematic way, LLVM provides some useful utilities for profiling the execution time.
Adding time measurements 273
Time profiling has always been an important topic in software development. With the running time collected from individual software components, we can spot performance bottlenecks more easily. In this section, we are going to learn about two tools provided by LLVM: the Timer class and the TimeTraceScope class. Let's start with the Timer class first.
Using the Timer class The Timer class, as suggested by its name, can measure the execution time of a code region. Here is an example of this:
#include "llvm/Support/Timer.h" Timer T("MyTimer", "A simple timer"); T.startTimer(); // Do some time-consuming works… T.stopTimer();
In the preceding snippet, Timer instance T measures the time spent in the region, enclosed by the startTimer and stopTimer method calls. Now that we have collected the timing data, let's try to print it out. Here is an example of this:
Timer T(…); TimeRecord TR = T.getTotalTime(); TR.print(TR, errs());
In the previous code snippet, a TimeRecord instance encapsulates the data collected by the Timer class. We can then use TimeRecord::print to print it to a stream—in this case, the errs() stream. In addition, we assigned another TimeRecord instance—via the first argument of print—as the total time interval we want to compare it against. Let's look at the output of this code, as follows:
===---------------------------------------------------------=== Miscellaneous Ungrouped Timers ===---------------------------------------------------------===
     ---User Time---           --User+System--           ---Wall Time---         ---
  Name ---
274 Gearing Up with Support Utilities
     0.0002 (100.0%)            0.0002 (100.0%)       0.0002 (100.0%)       A
  simple timer
     0.0002 (100.0%)            0.0002 (100.0%)       0.0002 (100.0%)       Total
0.0002 (100.0%) 0.0002 (100.0%) 0.0002 (100.0%)
In the preceding output, the first row shows the TimeRecord instance collected from our previous Timer instance, whereas the second row shows the total time—the first argument of TimeRecord::print. We now know how to print the timing data collected by a single Timer instance, but what about multiple timers? LLVM provides another support utility for the Timer class: the TimerGroup class. Here's an example usage of the TimerGroup class:
TimerGroup TG("MyTimerGroup", "My collection of timers");
Timer T("MyTimer", "A simple timer", TG); T.startTimer(); // Do some time-consuming works… T.stopTimer();
Timer T2("MyTimer2", "Yet another simple timer", TG); T2.startTimer(); // Do some time-consuming works… T2.stopTimer();
TG.print(errs());
In the preceding code snippet, we declare a TimerGroup instance, TG, and use it as the third constructor argument for each Timer instance we create. Finally, we print them using TimerGroup::print. Here is the output of this code:
  ===---------------------------------------------------------===
                      My collection of timers
  ===---------------------------------------------------------===
    Total Execution Time: 0.0004 seconds (0.0004 wall clock)
     ---User Time---            --User+System--       ---Wall Time---       ---
  Name ---
     0.0002 ( 62.8%)            0.0002 ( 62.8%)       0.0002 ( 62.8%)       A
Adding time measurements 275
  simple timer
     0.0001 ( 37.2%)   0.0001 ( 37.2%)                  0.0001 ( 37.2%)         Yet
  another simple timer
     0.0004 (100.0%)   0.0004 (100.0%)                  0.0004 (100.0%)         Total
Each row in the output (except the last one) is the TimeRecord instance for each Timer instance in this group. So far, we have been using Timer::startTimer and Timer::stopTimer to toggle the timer. To make measuring the time interval within a code block—namely, the region enclosed with curly brackets {}—easier without manually calling those two methods, LLVM provides another utility that automatically starts the timer upon entering a code block and turns it off when exiting. Let's see how to use the TimeRegion class with the following sample code:
  TimerGroup TG("MyTimerGroup", "My collection of timers");
  {
    Timer T("MyTimer", "A simple timer", TG);
    TimeRegion TR(T);
    // Do some time-consuming works…
  {
    Timer T("MyTimer2", "Yet another simple timer", TG);
    TimeRegion TR(T);
    // Do some time-consuming works…
TG.print(errs());
As you can see in the preceding snippet, instead of calling startTimer/stopTimer, we put the to-be-measured code into a separate code block and use a TimeRegion variable to automatically toggle the timer. This code will print out the same content as the previous example. With the help of TimeRegion, we can have a more concise syntax and avoid any mistakes where we forget to turn off the timer. You have now learned how to use Timer and its supporting utilities to measure the execution time of a certain code region. In the next section, we are going to learn a more advanced form of time measurement that captures the hierarchical structure of the program.
276 Gearing Up with Support Utilities
Collecting the time trace In the previous section, we learned how to use Timer to collect the execution time of a small range of code regions. Although that gave us a portrait of the compiler's runtime performance, we sometimes need a more structural timing profile in order to fully understand any systematic issues. TimeTraceScope is a class provided by LLVM to perform global-scope time profiling. Its usage is pretty simple: similar to TimeRegion, which we saw in the previous section, a TimeTraceScope instance automatically turns the time profiler on and off upon entering and exiting a code block. Here is an example of this:
  TimeTraceScope OuterTimeScope("TheOuterScope");
  for (int i = 0; i < 50; ++i) {
    {
      TimeTraceScope InnerTimeScope("TheInnerScope");
      foo();
    bar();
In the preceding code snippet, we create two TimeTraceScope instances: OuterTimeScope and InnerTimeScope. These try to profile the execution time of the whole region and the time spent on function foo, respectively. Normally, if we use Timer rather than TimeTraceScope, it can only give us the aggregate duration collected from each timer. However, in this case, we are more interested in how different parts of the code allocate themselves on the timeline. For example, does the foo function always spend the same amount of time ion every loop iteration? If that's not the case, which iterations spend more time than others? To see the result, we need to add additional command-line options to the opt command when running the Pass (assuming you use TimeTraceScope within a Pass). Here is an example of this:
$ opt –passes="…" -time-trace -time-trace-file=my_trace.json …
The additional -time-trace flag is asking opt to export all the traces collected by TimeTraceScope to the file designated by the -time-trace-file option.
Adding time measurements 277
After running this command, you will get a new file, my_trace.json. The content of this file is basically non-human-readable, but guess what? You can visualize it using the Chrome web browser. Here are the steps to do this:
  1. Open your Chrome web browser and type in chrome://tracing in the
     Uniform Resource Locator (URL) bar. You will see an interface that looks like this:
                          Figure 11.3 – The trace visualizer in Chrome
  2. Click on the Load button in the top-left corner and select our my_trace.json
     file. You will see a page like this:
                       Figure 11.4 – The view after opening my_trace.json
      Each color block represents a time interval collected by a TimeTraceScope
      instance.
  3. Let's take a closer look: please press the number key 3 to switch to zoom mode.
     After that, you should be able to zoom in or out by clicking and dragging the mouse
     up or down. In the meantime, you can use the arrow keys to scroll the timeline left
     or right. Here is part of the timeline after we zoom in:
Figure 11.5 – Part of the trace timeline
278 Gearing Up with Support Utilities
      As we can see from Figure 11.5, there are several layers stacking together. This
      layout reflects how different TimeTraceScope instances are organized in
      opt (and in our Pass). For example, our TimeTraceScope instance entitled
      TheOuterScope is stacked above multiple TheInnerScope blocks. Each of the
      TheInnerScope blocks represents the time spent on the foo function in each
      loop iteration we saw earlier.
  4. We can further inspect the properties of a block by clicking on it. For example, if we
     click one of the TheInnerScope blocks, its timing properties will be shown in the
     lower half of the screen. Here is an example of this:
                           Figure 11.6 – Details of a time interval block
      This gives us information such as the time interval and the starting time in this
      timeline.
With this visualization, we can combine timing information with the structure of the
compiler, which will help us to find out performance bottlenecks more rapidly.
In addition to opt, clang can also generate the same trace JSON file. Please consider
adding a -ftime-trace flag. Here is an example of this:
$ clang -O3 -ftime-trace -c foo.c
This will generate a JSON trace file with the same name as the input file. In this case, it will be foo.json. You can use the skills we just learned to visualize it. In this section, we have learned some useful skills to collect statistics from LLVM. The Statistic class can be used as an integer counter to record the number of events occurring in the optimization. Optimization remarks, on the other hand, can give us insights into some of the decision-making process inside the optimization Pass, making it easier for compiler developers to diagnose missing optimization opportunities. With Timer and TimeTraceScope, developers can monitor LLVM's execution time in a more manageable way and handle compilation-speed regressions with confidence. These techniques can improve an LLVM developer's productivity when creating new inventions or fixing a challenging problem.
Error-handling utilities in LLVM 279
In the next section of this chapter, we are going to learn how to write error-handling code in an efficient way, using utilities provided by LLVM.
Error-handling utilities in LLVM Error handling has always been a widely discussed topic in software development. It can be as simple as returning an error code—such as in many of the Linux APIs (for example, the open function)—or using an advanced mechanism such as throwing an exception, which has been widely adopted by many modern programming languages such as Java and C++. Although C++ has built-in support for exception handling, LLVM does not adopt it in its code base at all. The rationale behind this decision is that despite its convenience and expressive syntax, exception handling in C++ comes at a high cost in terms of performance. Simply speaking, exception handling makes the original code more complicated and hinders a compiler's ability to optimize it. Furthermore, during runtime, the program usually needs to spend more time recovering from an exception. Therefore, LLVM disables exception handling by default in its code base and falls back to other ways of error handling—for example, carrying an error with the return value or using the utilities we are going to learn about in this section. In the first half of this section, we are going to talk about the Error class, which—as the name suggests—represents an error. This is unlike conventional error representations— when using an integer as the error code, for instance, you cannot ignore the generated Error instances without handling it. We will explain this shortly. In addition to the Error class, developers found that in LLVM's code base a common pattern was shared by much of the error-handling code: an API may return a result or an error, but not both (at the same time). For instance, when we call a file-reading API, we are expecting to get the content of that file (the result) or an error when something goes wrong (for example, there is no such file). In the second part of this section, we are going to learn two utility classes that implement this pattern. Let's start with an introduction to the Error class first.
280 Gearing Up with Support Utilities
Introducing the Error class The concept represented by the Error class is pretty simple: it's an error with supplementary descriptions such as an error message or error code. It is designed to be passed by a value (as a function argument) or returned from a function. Developers are free to create their custom Error instance, too. For example, if we want to create a FileNotFoundError instance to tell users that a certain file does not exist, we can write the following code:
  #include "llvm/Support/Error.h"
  #include <system_error>
  // In the header file…
  struct FileNotFoundError : public ErrorInfo<FileNoteFoundError>
  {
     StringRef FileName;
     explicit FileNotFoundError(StringRef Name) : FileName(Name)
       {}
    static char ID;
    std::error_code convertToErrorCode() const override {
        return std::errc::no_such_file_or_directory;
    void log(raw_ostream &OS) const override {
        OS << FileName << ": No such file";
  };
  // In the CPP file…
  char FileNotFoundError::ID = 0;
There are several requirements for implementing a custom Error instance. These are listed next:
   • Derive from the ErrorInfo<T> class, where T is your custom class.
   • Declare a unique ID variable. In this case, we use a static class member variable.
   • Implement the convertToErrorCode method. This method designates a
     std::error_code instance for this Error instance. std::error_code is the
     error type used in the C++ standard library (since C++11). Please refer to the C++
     reference documentation for available (predefined) std::error_code instances.
   • Implement the log method to print out error messages.
Error-handling utilities in LLVM 281
To create an Error instance, we can leverage a make_error utility function. Here is an example usage of this:
Error NoSuchFileErr = make_error<FileNotFoundError>("foo.txt");
The make_error function takes an error class—in this case, our FileNotFoundError class—as the template argument and function arguments (in this case, foo.txt), if there are any. These will then be passed to its constructor. If you try to run the preceding code (in debug build) without doing anything to the NoSuchFileErr variable, the program will simply crash and show an error message such as this:
Program aborted due to an unhandled Error: foo.txt: No such file
It turns out that every Error instance is required to be checked and handled before the end of its lifetime (that is, when its destructor method is called). Let me first explain what checking an Error instance means. In addition to representing a real error, the Error class can also represent a success state—that is, no error. To give you a more concrete idea of this, many of the LLVM APIs have the following error-handling structure:
  Error readFile(StringRef FileName) {
    if (openFile(FileName)) {
      // Success
      // Read the file content…
      return ErrorSuccess();
    } else
      return make_error<FileNotFoundError>(FileName);
In other words, they return an ErrorSuccess instance in the case of success or an ErrorInfo instance otherwise. When the program returns from readFile, we need to check if the returned Error instance represents a success result or not by treating it as a Boolean variable, as follows:
Error E = readFile(…); if (E) { // TODO: Handle the error } else {
282 Gearing Up with Support Utilities
// Success!
Note that you always need to check an Error instance even if you are 100% sure that it is in a Success state, otherwise the program will still abort. The preceding code snippet provides a good segue into the topic of handling Error instances. If an Error instance represents a real error, we need to use a special API to handle it: handleErrors. Here's how to use it:
  Error E = readFile(…);
  if (E) {
    Error UnhandledErr = handleErrors(
      std::move(E),
      [&](const FileNotFoundError &NotFound) {
        NotFound.log(errs() << "Error occurred: ");
        errs() << "\n";
      });
The handleErrors function takes ownership of the Error instance (by std::move(E)) and uses the provided lambda function to handle the error. You might notice that handleErrors returns another Error instance, which represents the unhandled error. What does that mean? In the previous example of the readFile function, the returned Error instance can represent either a Success state or a FileNotFoundError state. We can slightly modify the function to return a FileEmptyError instance when the opened file is empty, as follows:
  Error readFile(StringRef FileName) {
    if (openFile(FileName)) {
      // Success
      if (Buffer.empty())
        return make_error<FileEmptyError>();
      else
        return ErrorSuccess();
    } else
Error-handling utilities in LLVM 283
return make_error<FileNotFoundError>(FileName);
Now, the Error instance returned from readFile can either be a Success state, a FileNotFoundError instance, or a FileEmptyError instance. However, the handleErrors code we wrote previously only handled the case of FileNotFoundError. Therefore, we need to use the following code to handle the case of FileEmptyError:
 Error E = readFile(…);
 if (E) {
   Error UnhandledErr = handleErrors(
     std::move(E),
     [&](const FileNotFoundError &NotFound) {…});
   UnhandledErr = handleErrors(
     std::move(UnhandledErr),
     [&](const FileEmptyError &IsEmpty) {…});
Be aware that you always need to take ownership of an Error instance when using handleErrors. Alternatively, you can coalesce two handleErrors function calls into one by using multiple lambda function arguments for each of the error types, as follows:
 Error E = readFile(…);
 if (E) {
   Error UnhandledErr = handleErrors(
     std::move(E),
     [&](const FileNotFoundError &NotFound) {…},
     [&](const FileEmptyError &IsEmpty) {…});
284 Gearing Up with Support Utilities
In other words, the handleErrors function is acting like a switch-case statement for an Error instance. It is effectively working like the following pseudocode:
  Error E = readFile(…);
  if (E) {
    switch (E) {
    case FileNotFoundError: …
    case FileEmptyError: …
    default:
      // generate the UnhandledError
Now, you might be wondering: Since handleErrors will always return an Error representing the unhandled error, and I can't just ignore the returned instance, otherwise the program will abort, how should we end this "chain of error handling"? There are two ways to do that, so let's have a look at each, as follows:
   • If you are 100% sure that you have handled all possible error types—which means
     that the unhandled Error variable is in a Success state—you can call the
     cantFail function to make an assertion, as illustrated in the following code
     snippet:
         if (E) {
           Error UnhandledErr = handleErrors(
             std::move(E),
             [&](const FileNotFoundError &NotFound) {…},
             [&](const FileEmptyError &IsEmpty) {…});
           cantFail(UnhandledErr);
      If UnhandledErr still contains an error, the cantFail function will abort the
      program execution and print an error message.
   • A more elegant solution would be to use the handleAllErrors function, as
     follows:
         if (E) {
           handleAllErrors(
             std::move(E),
             [&](const FileNotFoundError &NotFound) {…},
Learning about the Expected and ErrorOr classes 285
[&](const FileEmptyError &IsEmpty) {…});
This function will not return anything. It assumes that the given lambda functions are sufficient to handle all possible error types. Of course, if there is a missing one, handleAllErrors will still abort the program execution, just like what we have seen previously. You have now learned how to use the Error class and how to properly handle errors. Though the design of Error seems a little annoying at first glance (that is, we need to handle all possible error types or the execution will just abort halfway), these restrictions can decrease the number of mistakes made by programmers and create a more robust program. Next, we are going to introduce two other utility classes that can further improve the error-handling expressions in LLVM.
Learning about the Expected and ErrorOr classes As we briefly mentioned in the introduction of this section, in LLVM's code base it's pretty common to see a coding pattern where an API wants to return a result or an error if something goes wrong. LLVM tries to make this pattern more accessible by creating utilities that multiplex results and errors in a single object—they are the Expected and ErrorOr classes. Let's begin with the first one.
The Expected class The Expected class carries either a Success result or an error—for instance, the JSON library in LLVM uses it to represent the outcome of parsing an incoming string, as shown next:
#include "llvm/Support/JSON.h" using namespace llvm; // `InputStr` has the type of `StringRef` Expected<json::Value> JsonOrErr = json::parse(InputStr); if (JsonOrErr) { // Success!
286 Gearing Up with Support Utilities
    json::Value &Json = *JsonOrErr;
  } else {
    // Something goes wrong…
    Error Err = JsonOrErr.takeError();
    // Start to handle `Err`…
The preceding JsonOrErr class has a type of Expected<json::Value>. This means that this Expected variable either carries a json::Value-type Success result or an error, represented by the Error class we just learned about in the previous section. Just as with the Error class, every Expected instance needs to be checked. If it represents an error, that Error instance needs to be handled as well. To check the status of an Expected instance, we can also cast it to a Boolean type. However, unlike with Error, if an Expected instance contains a Success result, it will be true after being casted into a Boolean. If the Expected instance represents a Success result, you can fetch the result using either the * operator (as shown in the preceding code snippet), the -> operator, or the get method. Otherwise, you can retrieve the error by calling the takeError method before handling the Error instance, using the skills we learned in the previous section. Optionally, if you are sure that an Expected instance is in an Error state, you can check the underlying error type by calling the errorIsA method without retrieving the underlying Error instance first. For example, the following code checks if an error is a FileNotFoundError instance, which we created in the previous section:
  if (JsonOrErr) {
    // Success!
  } else {
    // Something goes wrong…
    if (JsonOrErr.errorIsA<FileNotFoundError>()) {
Learning about the Expected and ErrorOr classes 287
These are tips for consuming an Expected variable. To create an Expected instance, the most common way is to leverage the implicit type conversion to Expected. Here is an example of this:
  Expected<std::string> readFile(StringRef FileName) {
    if (openFile(FileName)) {
      std::string Content;
      // Reading the file…
      return Content;
    } else
      return make_error<FileNotFoundError>(FileName);
The preceding code shows that in cases where something goes wrong, we can simply return an Error instance, which will be implicitly converted into an Expected instance representing that error. Similarly, if everything goes pretty smoothly, the Success result—in this case, the std::string type variable, Content—will also be implicitly converted into an Expected instance with a Success state. You have now learned how to use the Expected class. The last part of this section will show you how to use one of its sibling classes: ErrorOr.
The ErrorOr class The ErrorOr class uses a model that is nearly identical to the Expected class— it is either a Success result or an error. Unlike the Expected class, ErrorOr uses std::error_code to represent the error. Here is an example of using the MemoryBuffer API to read a file—foo.txt— and storing its content into a MemoryBuffer object:
  #include "llvm/Support/MemoryBuffer.h"
  ErrorOr<std::unique_ptr<MemoryBuffer>> ErrOrBuffer
    = MemoryBuffer::getFile("foo.txt");
  if (ErrOrBuffer) {
    // Success!
    std::unique_ptr<MemoryBuffer> &MB = *ErrOrBuffer;
  } else {
    // Something goes wrong…
    std::error_code EC = ErrOrBuffer.getError();
288 Gearing Up with Support Utilities
The previous code snippet shows a similar structure, with the sample code for Expected we saw previously: the std::unique_ptr<MemoryBuffer> instance is the type of success result here. We can also retrieve it using the * operator after checking the state of ErrOrBuffer. The only difference here is that if ErrOrBuffer is in an Error state, the error is represented by a std::error_code instance rather than Error. Developers are not obliged to handle a std::error_code instance—in other words, they can just ignore that error, which might increase the chances of other developers making mistakes in the code. Nevertheless, using the ErrorOr class can give you better interoperability with C++ standard library APIs, as many of them use std::error_code to represent errors. For details about how to use std::error_code, please refer to the C++ reference documentation. Finally, to create an ErrorOr instance, we are using the same trick we used on the Expected class—leveraging implicit conversion, as shown in the following code snippet:
  #include <system_error>
  ErrorOr<std::string> readFile(StringRef FileName) {
    if (openFile(FileName)) {
      std::string Content;
      // Reading the file…
      return Content;
    } else
      return std::errc::no_such_file_or_directory;
The std::errc::no_such_file_or_directory object is one of the predefined std::error_code objects from the system_error header file. In this section, we learned how to use some error-handling utilities provided by LLVM— the important Error class that imposes strict rules on unhandled errors, and the Expected and ErrorOr classes that provide you with a handy way of multiplexing the program result and error state in a single object. These tools can help you to write expressive yet robust error-handling code when developing with LLVM.
Summary 289
Summary In this chapter, we learned lots of useful utilities that can improve our productivity when developing with LLVM. Some of them—such as optimization remarks or timers—are useful for diagnosing problems raised by LLVM, while others—the Error class, for instance—help you to build more robust code that scales well with the complexity of your own compiler. In the final chapter of this book, we are going to learn about profile-guided optimization (PGO) and sanitizer development, which are advanced topics that you can't miss.