Ch 12 — Learning LLVM IR Instrumentation
Learning LLVM IR Instrumentation In the previous chapter, we learned how to leverage various utilities to improve our productivity while developing with LLVM. Those skills can give us a smoother experience when diagnosing problems that are raised by LLVM. Some of these utilities can even reduce the number of potential mistakes that are made by compiler engineers. In this chapter, we are going to learn how instrumentation works in LLVM IR. The instrumentation we are referring to here is a kind of technique that inserts some probes into the code we are compiling in order to collect runtime information. For example, we can collect information about how many times a certain function was called – which is only available once the target program has been executed. The advantage of this technique is that it provides extremely accurate information about the target program's behavior. This information can be used in several different ways. For instance, we can use the collected values to compile and optimize the same code again – but this time, since we have accurate data, we can perform more aggressive optimizations that couldn't be done previously. This technique is also called Profile-Guided Optimization (PGO). In another example, will be using the inserted probes to catch undesirable incidents that happened at runtime – buffer overflows, race conditions, and double-free memory, to name a few. The probe that's used for this purpose is also called a sanitizer.
292 Learning LLVM IR Instrumentation
To implement instrumentation in LLVM, we not only need the help of LLVM pass, but also the synergy between multiple subprojects in LLVM – Clang, LLVM IR Transformation, and Compiler-RT. We already know about the first two from earlier chapters. In this chapter, we are going to introduce Compiler-RT and, more importantly, how can we combine these subsystems for the purpose of instrumentation. Here is the list of topics we are going to cover:
• Developing a sanitizer • Working with PGO
In the first part of this chapter, we are going to see how a sanitizer is implemented in Clang and LLVM, before creating a simple one by ourselves. The second half of this chapter is going to show you how to use the PGO framework in LLVM and how we can extend it.
Technical requirements In this chapter, we are going to work with multiple subprojects. One of them – Compiler-RT – needs to be included in your build by us modifying the CMake configuration. Please open the CMakeCache.txt file in your build folder and add the compiler-rt string to the value of the LLVM_ENABLE_PROJECTS variable. Here is an example:
//Semicolon-separated list of projects to build… LLVM_ENABLE_PROJECTS:STRING="clang;compiler-rt"
After editing the file, launch a build with any build target. CMake will try to reconfigure itself. Once everything has been set up, we can build the components we need for this chapter. Here is an example command:
$ ninja clang compiler-rt opt llvm-profdata
This will build the clang tool we're all familiar with and a collection of Compiler-RT libraries, which we are going to introduce shortly. You can find the sample code for this chapter in the same GitHub repository: https://github.com/PacktPublishing/LLVM-Techniques-Tips-andBest-Practices-Clang-and-Middle-End-Libraries/tree/main/ Chapter12.
Developing a sanitizer 293
Developing a sanitizer A sanitizer is a kind of technique that checks certain runtime properties of the code (probe) that's inserted by the compiler. People usually use a sanitizer to ensure program correctness or enforce security policies. To give you an idea of how a sanitizer works, let's use one of the most popular sanitizers in Clang as an example – the address sanitizer.
An example of using an address sanitizer Let's assume we have some simple C code, such as the following:
  int main(int argc, char **argv) {
    int buffer[3];
    for (int i = 1; i < argc; ++i)
      buffer[i-1] = atoi(argv[i]);
      for (int i = 1; i < argc; ++i)
        printf("%d ", buffer[i-1]);
      printf("\n");
      return 0;
The preceding code converted the command-line arguments into integers and stored them in a buffer of size 3. Then, we printed them out. You should be able to easily spot an outstanding problem: the value of argc can be arbitrarily big when it's larger than 3 – the size of buffer. Here, we are storing the value in an invalid memory location. However, when we compile this code, the compiler will say nothing. Here is an example:
$ clang -Wall buffer_overflow.c -o buffer_overflow $ # No error or warning
In the preceding command, even if we enable all the compiler warnings via the -Wall flag, clang won't complain about the potential bug. If we try to execute the buffer_overflow program, the program will crash at some time point after we pass more than three command-line arguments to it; for example:
$ ./buffer_overflow 1 2 3 $ ./buffer_overflow 1 2 3 4
294 Learning LLVM IR Instrumentation
Segmentation fault (core dumped) $
What's worse, the number of command-line arguments to crash buffer_overflow actually varies from machine to machine. This makes it even more difficult to debug if the example shown here were a real-world bug. To summarize, the problem we're encountering here is caused by the fact that buffer_overflow only goes rogue on some inputs and the compiler failed to catch the problem. Now, let's try to use an address sanitizer to catch this bug. The following command asks clang to compile the same code with an address sanitizer:
$ clang -fsanitize=address buffer_overflow.c -o san_buffer_ overflow
Let's execute the program again. Here is the output:
$ ./san_buffer_overflow 1 2 3 $ ./san_buffer_overflow 1 2 3 4 ============================================================== === ==137791==ERROR: AddressSanitizer: stack-buffer-overflow on address 0x7ffea06bccac at pc 0x0000004f96df bp 0x7ffea06bcc70… WRITE of size 4 at 0x7ffea06bccac thread T0 This frame has 1 object(s): [32, 44) 'buffer' <== Memory access at offset 44 overflows this variable ==137791==ABORTING $
Instead of just crashing, the address sanitizer gave us many details about the issue that was raised at runtime: the sanitizer told us that it detected a buffer overflow on the stack, which might be the buffer variable. These messages were extremely useful. Imagine that you are working on a much more complicated software project. When a strange memory bug occurs, rather than just crash or silently change the program's logic, the address sanitizer can point out the problematic area – with high accuracy – right away.
Developing a sanitizer 295
To go a little deeper into its mechanisms, the following diagram illustrates how the address sanitizer detects the buffer overflow:
Figure 12.1 – Instrumentation code inserted by the address sanitizer Here, we can see that the address sanitizer is effectively inserting a boundary check into the array index that's used for accessing buffer. With this extra check – which will be executed at runtime – the target program can bail out with error details before violating the memory access. More generally speaking, during the compilation, a sanitizer inserts some instrumentation code (into the target program) that will eventually be executed at runtime to check or guard certain properties.
        Detecting overflow using an address sanitizer
        The preceding diagram shows a simplified version of how an address sanitizer
        works. In reality, the address sanitizer will leverage multiple strategies to
        monitor memory access in a program. For example, an address sanitizer can
        use a special memory allocator that allocates memory with traps put at the
        invalid memory region.
While an address sanitizer is specialized in catching illegal memory access, a ThreadSanitizer can be used to catch data race conditions; that is, invalid access from multiple threads on the same chunk of data. Some other examples of sanitizers in Clang are the LeakSanitizer, which is used for detecting sensitive data such as passwords being leaked, and MemorySanitizer, which is used for detecting reads to uninitialized memory. Of course, there are some downsides to using sanitizers. The most prominent problem is the performance impact: using a thread sanitizer (in Clang) as an example, programs that are compiled with one are 5~15 times slower than the original version. Also, since sanitizers insert extra code into the program, it might hinder some optimization opportunities, or even affect the original program's logic! In other words, it is a trade-off between the robustness and performance of the target program.
296 Learning LLVM IR Instrumentation
With that, you've learned about the high-level idea of a sanitizer. Let's try to create a real one by ourselves to understand how Clang and LLVM implement a sanitizer. The following section contains more code than any of the examples in previous chapters, not to mention the changes are spread across different subprojects in LLVM. To focus on the most important knowledge, we won't go into the details of some supporting code – for example, changes that are made to CMake build scripts. Instead, we will go through them by providing a brief introduction and pointing out where you can find it in this book's GitHub repository. Let's start by providing an overview of the project we are going to create.
Creating a loop counter sanitizer To (slightly) simplify our task, the sanitizer we are going to create – a loop counter sanitizer, or LPCSan for short – looks just like a sanitizer except that it is not checking any serious program properties. Instead, we want to use it to print out the real, concrete trip count – the number of iterations – of a loop, which is only available during runtime. For example, let's assume we have the following input code:
  void foo(int S, int E, int ST, int *a) {
    for (int i = S; i < E; i += ST) {
      a[i] = a[i + 1];
  int main(int argc, char **argv) {
    int start = atoi(argv[1]),
        end = atoi(argv[2]),
        step = atoi(argv[3]);
    int a[100];
    foo(start, end, step, a);
    return 0;
We can compile it with a LPCSan using the following command:
$ clang -O1 -fsanitize=loop-counter test_lpcsan.c -o test_ lpcsan
Note that compiling with optimization greater than -O0 is necessary; we will explain why later.
Developing a sanitizer 297
When we execute test_lpcsan (with some command-line argument), we can print out the precise trip count of the loop in the foo function. For example, look at the following code:
$ ./test_lpcsan 0 100 1 ==143813==INFO: Found a loop with trip count 100 $ ./test_lpcsan 0 50 2 ==143814==INFO: Found a loop with trip count 25 $
The message highlighted in the preceding code was printed by our sanitizer code. Now, let's dive into the steps for creating the LPCSan. We will divide this tutorial into three parts:
• Developing an IR transformation • Adding Compiler-RT components • Adding the LPCSan to Clang
We will start with the IR transformation part of this sanitizer.
Developing an IR transformation Previously, we learned that an address sanitizer – or just a sanitizer in general – usually inserts code into the target program to check certain runtime properties or collect data. In Chapter 9, Working with PassManager and AnalysisManager, and Chapter 10, Processing LLVM IR, we learned how to modify/transform LLVM IR, including inserting new code into it, so this seems to be a good starting point for crafting our LPCSan. In this section, we are going to develop an LLVM pass called LoopCounterSanitizer that inserts special function calls to collect the exact trip count of every loop in Module. Here are the detailed steps:
  1. First, let's create two files: LoopCounterSanitizer.cpp under the llvm/
     lib/Transforms/Instrumentation folder and its corresponding header file
     inside the llvm/include/llvm/Transforms/Instrumentation folder.
     Inside the header file, we will place the declaration of this pass, as shown here:
          struct LoopCounterSanitizer
            : public PassInfoMixin<LoopCounterSanitizer> {
            PreservedAnalyses run(Loop&, LoopAnalysisManager&,
                                  LoopStandardAnalysisResults&,
                                  LPMUpdater&);
298 Learning LLVM IR Instrumentation
         private:
            // Sanitizer functions
           FunctionCallee LPCSetStartFn, LPCAtEndFn;
            void initializeSanitizerFuncs(Loop&);
         };
      The preceding code shows the typical loop pass structure we saw in Chapter 10,
      Processing LLVM IR. The only notable changes are the LPCSetStartFn and
      LPCAtEndFn memory variables – they will store the Function instances that
      collect loop trip counts (FunctionCallee is a thin wrapper around Function
      that provides additional function signature information).
 2. Finally, in LoopCounterSanitizer.cpp, we are placing the skeleton code for
    our pass, as shown here:
         PreservedAnalyses
         LoopCounterSanitizer::run(Loop &LP, LoopAnalysisManager
         &LAM, LoopStandardAnalysisResults &LSR, LPMUpdater &U) {
           initializeSanitizerFuncs(LP);
           return PreservedAnalyses::all();
      The initializeSanitizerFuncs method in the preceding code will
      populate LPCSetStartFn and LPCAtEndFn. Before we go into the details of
      initializeSanitizerFuncs, let's talk more about LPCSetStartFn and
      LPCAtEndFn.
 3. To figure out the exact trip count, the Function instance stored in
    LPCSetStartFn will be used to collect the initial induction variable value of a
    loop. On the other hand, the Function instance stored in LPCAtEndFn will be
    used to collect the final induction variable value and the step value of the loop. To
    give you a concrete idea of how these two Function instances work together, let's
    assume we have the following pseudocode as our input program:
         void foo(int S, int E, int ST) {
           for (int i = S; i < E; i += ST) {
Developing a sanitizer 299
   In the preceding code, the S, E, and ST variables represent the initial, final, and step
   values of a loop, respectively. The goal of the LoopCounterSanitizer pass is to
   insert LPCSetStartFn and LPCAtEndFn in the following way:
      void foo(int S, int E, int ST) {
        for (int i = S; i < E; i += ST) {
          lpc_set_start(S);
          lpc_at_end(E, ST);
   lpc_set_start and lpc_at_end in the preceding code are Function
   instances that are stored in LPCSetStartFn and LPCAtEndFn, respectively. Here
   is one of the possible (pseudo) implementations of these two functions:
      static int CurrentStartVal = 0;
      void lpc_set_start(int start) {
        CurrentStartVal = start;
      void lpc_at_end(int end, int step) {
        int trip_count = (end – CurrentStartVal) / step;
        printf("Found a loop with trip count %d\n",
         trip_count);
   Now that we know the roles of LPCSetStartFn and LPCAtEndFn, it's time to
   take a look at how initializeSanitizerFuncs initializes them.
4. Here is the code inside initializeSanitizerFuncs:
      void LoopCounterSanitizer::initializeSanitizerFuncs(Loop
      &LP) {
        Module &M = *LP.getHeader()->getModule();
        auto &Ctx = M.getContext();
        Type *VoidTy = Type::getVoidTy(Ctx),
             *ArgTy = Type::getInt32Ty(Ctx);
        LPCSetStartFn
          = M.getOrInsertFunction("__lpcsan_set_loop_start",
                                  VoidTy, ArgTy);
300 Learning LLVM IR Instrumentation
             LPCAtEndFn = M.getOrInsertFunction("__lpcsan_at_loop_
              end", VoidTy, ArgTy, ArgTy);
      The previous code is basically fetching two functions, __lpcsan_set_loop_
      start and __lpcsan_at_loop_end, from the module and storing their
      Function instances in LPCSetStartFn and LPCAtEndFn, respectively.
      The Module::getOrInsertFunction method either grabs the Function
      instance of the given function name from the module or creates one if it doesn't
      exist. If it's a newly created instance, it has an empty function body; in other words,
      it only has a function declaration.
      It is also worth noting that the second argument of
      Module::getOrInsertFunction is the return type of the Function inquiry.
      The rest (the arguments for getOrInsertFunction) represent the argument
      types of that Function.
      With LPCSetStartFn and LPCAtEndFn set up, let's see how we can insert them
      into the right place in IR.
 5. Recall that in Chapter 10, Processing LLVM IR, we learned about several utility
    classes for working with Loop. One of them – LoopBounds – can give us the
    boundary of a Loop. We can do this by including the start, end, and step values of
    an induction variable, which is exactly the information we are looking for. Here is
    the code that tries to retrieve a LoopBounds instance:
         PreservedAnalyses
         LoopCounterSanitizer::run(Loop &LP, LoopAnalysisManager
         &LAM, LoopStandardAnalysisResults &LSR, LPMUpdater &U) {
           initializeSanitizerFuncs(LP);
           ScalarEvolution &SE = LSR.SE;
             using LoopBounds = typename Loop::LoopBounds;
             auto MaybeLB = LP.getBounds(SE);
             if (!MaybeLB) {
               errs() << "WARNING: Failed to get loop bounds\n";
               return PreservedAnalyses::all();
             LoopBounds &LB = *MaybeLB;
Developing a sanitizer 301
          Value *StartVal = &LB.getInitialIVValue(),
                *EndVal = &LB.getFinalIVValue(),
                *StepVal = LB.getStepValue();
Loop::getBounds from the preceding code returned an Optional<LoopBounds> instance. The Optional<T> class is a useful container that either stores an instance of the T type or is empty. You can think of it as a replacement for the null pointer: usually, people use T* to represent a computation result where a null pointer means an empty value. However, this has the risk of dereferencing a null pointer if the programmer forgets to check the pointer first. The Optional<T> class doesn't have this problem. With a LoopBounds instance, we can retrieve the induction variable's range and store it in the StartVal, EndVal, and StepVal variables. 6. StartVal is the Value instance to be collected by __lpcsan_set_loop_ start, whereas __lpcsan_at_loop_end is going to collect EndVal and StepVal at runtime. Now, the question is, where should we insert function calls to __lpcsan_set_loop_start and __lpcsan_at_loop_end to correctly collect those values? The rule of thumb is that we need to insert those function calls after the definition of those values. While we can find the exact locations where those values were defined, let's try to simplify the problem by inserting instrumentation function calls at some fixed locations – locations where our target values are always available. For __lpcsan_set_loop_start, we are inserting it at the end of the loop header block, because the initial induction variable value will never be defined after this block. Here is the code: // Inside LoopCounterSanitizer::run … BasicBlock *Header = LP.getHeader(); Instruction *LastInst = Header->getTerminator(); IRBuilder<> Builder(LastInst); Type *ArgTy = LPCSetStartFn.getFunctionType()- >getParamType(0);
      if (StartVal->getType() != ArgTy) {
        // cast to argument type first
        StartVal = Builder.CreateIntCast(StartVal, ArgTy,
302 Learning LLVM IR Instrumentation
         true);
         Builder.CreateCall(LPCSetStartFn, {StartVal});
      In the preceding code, we used getTerminator to get the last Instruction
      from the header block. Then, we used IRBuilder<> – with the last instruction as
      the insertion point – to insert new Instruction instances.
      Before we can pass StartVal as an argument to the new __lpcsan_set_loop_
      start function call, we need to convert its IR type (represented by the Type class) into a
      compatible one. IRBuilder::CreateInstCast is a handy utility that automatically
      generates either an instruction to extend the integer bit width or an instruction to truncate
      the bit width, depending on the given Value and Type instances.
      Finally, we can create a function call to __lpcsan_set_loop_start via
      IRBuilder::CreateCall, with StartVal as the function call argument.
 7. For __lpcsan_at_loop_end, we are using the same trick to collect the runtime
    values of EndVal and StepVal. Here is the code:
         BasicBlock *ExitBlock = LP.getExitBlock();
         Instruction *FirstInst = ExitBlock->getFirstNonPHI();
         IRBuilder<> Builder(FirstInst);
         FunctionType *LPCAtEndTy = LPCAtEndFn.getFunctionType();
         Type *EndArgTy = LPCAtEndTy->getParamType(0),
              *StepArgTy = LPCAtEndTy->getParamType(1);
         if (EndVal->getType() != EndArgTy)
           EndVal = Builder.CreateIntCast(EndVal, EndArgTy, true);
         if (StepVal->getType() != StepArgTy)
           StepVal = Builder.CreateIntCast(StepVal, StepArgTy,
            true);
Builder.CreateCall(LPCAtEndFn, {EndVal, StepVal});
Developing a sanitizer 303
      Different from the previous step, we are inserting the function call to __lpcsan_
      at_loop_end at the beginning of the exit block. This is because we can always
      expect the end value and the step value of the induction variable being defined
      before we leave the loop.
      These are all the implementation details for the LoopCounterSanitizer pass.
  8. Before we wrap up this section, we need to edit a few more files to make sure
     everything works. Please look at the Changes-LLVM.diff file in the sample code
     folder for this chapter. Here is the summary of the changes that were made in other
     supporting files:
      i. Changes in llvm/lib/Transforms/Instrumentation/CMakeLists.
         txt: Add our new pass source file to the build.
      ii. C
           hanges in llvm/lib/Passes/PassRegistry.def: Add our pass to the
          list of available passes so that we can test it using our old friend opt.
With that, we've finally finished making all the necessary modifications to the LLVM part.
Before we move on to the next section, let's test our newly created
LoopCounterSanitizer pass. We are going to be using the same C code we saw
earlier in this section. Here is the function that contains the loop we want to instrument:
  void foo(int S, int E, int ST, int *a) {
    for (int i = S; i < E; i += ST) {
      a[i] = a[i + 1];
Note that although we didn't explicitly check the loop form in our pass, some of the APIs that were used in the pass actually required the loop to be rotated, so please generate the LLVM IR code with an O1 optimization level to make sure the loop rotation's Pass has kicked in: Here is the simplified LLVM IR for the foo function:
  define void @foo(i32 %S, i32 %E, i32 %ST, i32* %a) {
    %cmp9 = icmp slt i32 %S, %E
    br i1 %cmp9, label %for.body.preheader, label %for.cond.
     cleanup
  for.body.preheader:
    %0 = sext i32 %S to i64
304 Learning LLVM IR Instrumentation
      %1 = sext i32 %ST to i64
      %2 = sext i32 %E to i64
      br label %for.body
  for.body:
    %indvars.iv = phi i64 [ %0, %for.body.preheader ], [
    %indvars.iv.next, %for.body ]
    %indvars.iv.next = add i64 %indvars.iv, %1
    %cmp = icmp slt i64 %indvars.iv.next, %2
    br i1 %cmp, label %for.body, label %for.cond.cleanup
The highlighted labels are the preheader and loop body blocks for this loop. Since this loop has been rotated, the for.body block is both the header, latch, and exiting block for this loop. Now, let's transform this IR with opt using the following command:
$ opt -S –passes="loop(lpcsan)" input.ll -o -
In the –passes command-line option, we asked opt to run our LoopCounterSanitizer pass (with the name lpcsan, which is registered in the PassRegistry.def file). The enclosing loop(…) string is simply telling opt that lpcsan is a loop pass (you can actually omit this decoration since opt can find the right pass most of the time). Here is the simplified result:
declare void @__lpcsan_set_loop_start(i32) declare void @__lpcsan_at_loop_end(i32, i32)
  define void @foo(i32 %S, i32 %E, i32* %a) {
    %cmp8 = icmp slt i32 %S, %E
    br i1 %cmp8, label %for.body.preheader, label %for.cond.
  cleanup
  for.body.preheader:
    %0 = sext i32 %S to i64
    %wide.trip.count = sext i32 %E to i64
Developing a sanitizer 305
br label %for.body
  for.cond.cleanup.loopexit:
    %1 = trunc i64 %wide.trip.count to i32
    call void @__lpcsan_at_loop_end(i32 %1, i32 1)
    br label %for.cond.cleanup
  for.body:
    %3 = trunc i64 %0 to i32
    call void @__lpcsan_set_loop_start(i32 %3)
    br i1 %exitcond.not, label %for.cond.cleanup.loopexit, label
      %for.body
As you can see, __lpcsan_set_loop_start and __lpcsan_at_loop_end have been correctly inserted into the header block and exit block, respectively. They are also collecting the desired values related to the loop trip count. Now, the biggest question is: where are the function bodies for __lpcsan_set_loop_start and __lpcsan_at_loop_end? Both only have declarations in the preceding IR code. In the next section, we will use Compiler-RT to answer this question.
Adding the Compiler-RT component The name Compiler-RT stands for Compiler RunTime. The usage of runtime is a little ambiguous here because too many things can be called a runtime in a normal compilation pipeline. But the truth is that Compiler-RT does contain a wide range of libraries for completely different tasks. What these libraries have in common is that they provide supplement code for the target program to implement enhancement features or functionalities that were otherwise absent. It is important to remember that Compiler-RT libraries are NOT used for building a compiler or related tool – they should be linked with the program we are compiling.
306 Learning LLVM IR Instrumentation
One of the most used features in Compiler-RT is the builtin function. As you might have heard, more and more computer architectures nowadays support vector operation natively. That is, you can process multiple data elements at the same time with the support from hardware. Here is some example code, written in C, that uses vector operations:
typedef int v4si __attribute__((__vector_size__(16))); v4si v1 = (v4si){1, 2, 3, 4}; v4si v2 = (v4si){5, 6, 7, 8}; v4si v3 = v1 + v2; // = {6, 8, 10, 12}
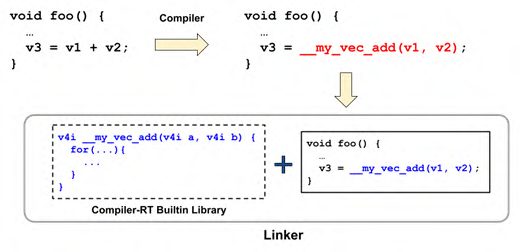
The preceding code used a non-standardized (currently, you can only use this syntax in Clang and GCC) C/C++ vector extension to declare two vectors, v1 and v2, before adding them to yield a third one. On X86-64 platforms, this code will be compiled to use one of the vector instruction sets, such as SSE or AVX. On the ARM platform, the resulting binary might be using the NEON vector instruction set. But what if your target platform does NOT have a vector instruction set? The most obvious solution would be "synthesizing" these unsupported operations with the available instructions. For example, we should write a for-loop to replace vector summation in this case. More specifically, whenever we see a vector summation at compilation time, we replace it with a call to a function that contains the synthesis implementation using for-loop. The function body can be put anywhere, as long as it is eventually linked with the program. The following diagram illustrates this process:
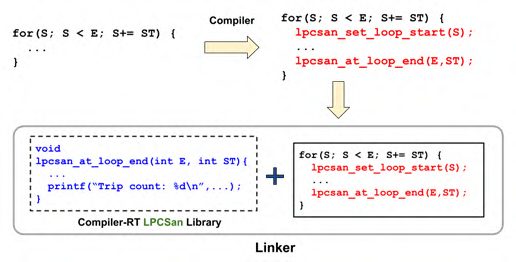
Figure 12.2 – Workflow of the Compiler-RT builtin As you may have noticed, the workflow shown here is similar to our requirement in the LPCSan: in the previous section, we developed an LLVM pass that inserted extra function calls to collect the loop trip count, but we still need to implement those collector functions. If we leverage the workflow shown in the preceding diagram, we can come up with a design, as shown in the following diagram:
Developing a sanitizer 307
Figure 12.3 – Workflow of the Compiler-RT LPCSan component The previous diagram shows that the function bodies of __lpcsan_set_loop_start and __lpcsan_at_loop_end are put inside a Compiler-RT library that will eventually be linked with the final binary. Inside these two functions, we calculate the trip count using the input arguments and print the result. In the rest of this section, we'll show you how to create such a Compiler-RT library for the LPCSan. Let's get started:
  1. First, switch the folder to llvm-project/compiler-rt, the root of
     Compiler-RT. Inside this subproject, we must create a new folder called lib/
     lpcsan before we put a new lpcsan.cpp file inside it. Within this file, let's create
     the skeleton for our instrumentation functions. Here is the code:
         #include "sanitizer_common/sanitizer_common.h"
         #include "sanitizer_common/sanitizer_internal_defs.h"
         using namespace __sanitizer;
         extern "C" SANITIZER_INTERFACE_ATTRIBUTE
         void __lpcsan_set_loop_start(s32 start){
           // TODO
         extern "C" SANITIZER_INTERFACE_ATTRIBUTE
         void __lpcsan_at_loop_end(s32 end, s32 step){
           // TODO
308 Learning LLVM IR Instrumentation
      There are two things worth noting here: first, use the primitive data types provided
      by Compiler-RT. For example, in the preceding code, we used s32 – available under
      the __sanitizer namespace – for a signed 32-bit integer rather than the normal
      int. The rationale behind this is that we might need to build Compiler-RT libraries
      for different hardware architectures or platforms, and the width of int might not
      be 32 bits on some of them.
      Second, although we are using C++ to implement our instrumentation functions,
      we need to expose them as C functions because C functions have a more stable
      Application Binary Interface (ABI). Therefore, please make sure to add extern
      "C" to functions you want to export. The SANITIZER_INTERFACE_ATTRIBUTE
      macro also ensures that the function will be exposed at the library interface
      correctly, so please add this as well.
 2. Next, we will add the necessary code to these two functions. Here is how we do this:
         static s32 CurLoopStart = 0;
         extern "C" SANITIZER_INTERFACE_ATTRIBUTE
         void __lpcsan_set_loop_start(s32 start){
           CurLoopStart = start;
         extern "C" SANITIZER_INTERFACE_ATTRIBUTE
         void __lpcsan_at_loop_end(s32 end, s32 step){
           s32 trip_count = (end - CurLoopStart) / step;
           s32 abs_trip_count
             = trip_count >= 0? trip_count : -trip_count;
           Report("INFO: Found a loop with "
                  "trip count %d\n", abs_trip_count);
      The implementation we used here is pretty straightforward: CurLoopStart is a
      global variable that memorizes the initial induction variable value of the current
      loop. This is updated by __lpcsan_set_loop_start.
      Recall that when a loop is complete, __lpcsan_at_loop_end will be invoked.
      When that happens, we use the value stored in CurLoopStart and the end
      and step arguments to calculate the exact trip count of the current loop, before
      printing the result.
Developing a sanitizer 309
3. Now that we have implemented the core logic, it's time to build this library. Inside
   the lib/lpcsan folder, create a new CMakeLists.txt file and insert the
   following code:
       set(LPCSAN_RTL_SOURCES
           lpcsan.cpp)
       add_compiler_rt_component(lpcsan)
       foreach(arch ${LPCSAN_SUPPORTED_ARCH})
         set(LPCSAN_CFLAGS ${LPCSAN_COMMON_CFLAGS})
         add_compiler_rt_runtime(clang_rt.lpcsan
           STATIC
           ARCHS ${arch}
           SOURCES ${LPCSAN_RTL_SOURCES}
                  $<TARGET_OBJECTS:RTSanitizerCommon.${arch}>
                  $<TARGET_OBJECTS:RTSanitizerCommonLibc.${arch}>
           ADDITIONAL_HEADERS ${LPCSAN_RTL_HEADERS}
           CFLAGS ${LPCSAN_CFLAGS}
           PARENT_TARGET lpcsan)
       endforeach()
    In the preceding code, we are only showing the most important part of our
    CMakeLists.txt. Here are some highlights:
    i. Compiler-RT creates its own set of CMake macros/functions. Here, we are using
    two of them, add_compiler_rt_component and add_compiler_rt_
    runtime, to create a pseudo build target for the entire LPCSan and the real library
    build target, respectively.
    ii. Different from a conventional build target, if a sanitizer wants to use supporting/
    utility libraries in Compiler-RT – for example, RTSanitizerCommon in the
    preceding code – we usually link against their object files rather than their library
    files. More specifically, we can use the $<TARGET_OBJECTS:…> directive to
    import supporting/utility components as one of the input sources.
310 Learning LLVM IR Instrumentation
      iii. A sanitizer library can support multiple architectures and platforms. In
      Compiler-RT, we are enumerating all the supported architectures and creating
      a sanitizer library for each of them.
      Again, the preceding snippet is just a small part of our build script. Please refer
      to our sample code folder for the complete CMakeLists.txt file.
  4. To successfully build the LPCSan, we still need to make some changes in
     Compiler-RT. The Base-CompilerRT.diff patch in the same code folder
     provides the rest of the changes that are necessary to build our sanitizer. Apply
     it to Compiler-RT's source tree. Here is the summary of this patch:
      i. Changes in compiler-rt/cmake/config-ix.cmake basically specify
         the supported architectures and operating systems of the LPCSan. The
         LPCSAN_SUPPORTED_ARCH CMake variable we saw in the previous snippet
         comes from here.
      ii. Th
           e entire compiler-rt/test/lpcsan folder is actually a placeholder. For
          some reason, having tests is a requirement for every sanitizer in Compiler-RT –
          which is different from LLVM. Therefore, we are putting an empty test folder here
          to pass this requirement that's being imposed by the build infrastructure.
These are all the steps for producing a Compiler-RT component for our LPCSan.
To just build our LPCSan library, invoke the following command:
$ ninja lpcsan
Unfortunately, we can't test this LPCSan library until we've modified the compilation pipeline in Clang. In the last part of this section, we are going to learn how to achieve this task.
Adding the LPCSan to Clang In the previous section, we learned how Compiler-RT libraries provide supplement functionalities to the target program or assist with special instrumentation, such as the sanitizer we just created. In this section, we are going to put everything together so that we can use our LPCSan simply by passing the -fsanitize=loop-counter flag to clang.
Developing a sanitizer 311
Recall that in Figure 12.3, Compiler-RT libraries need to be linked with the program we are compiling. Also, recall that in order to insert the instrumentation code into the target program, we must run our LoopCounterSanitizer pass. In this section, we are going to modify the compilation pipeline in Clang so that it runs our LLVM pass at a certain time and sets up the correct configuration for our Compiler-RT library. More specifically, the following diagram shows the tasks that each component needs to complete to run our LPCSan:
Figure 12.4 – Tasks for each component in the pipeline Here are the descriptions for each of the numbers (enclosed in circles) in the preceding diagram:
  1. The driver needs to recognize the -fsanitize=loop-counter flag.
  2. When the frontend is about to generate LLVM IR from an Abstract Syntax Tree
     (AST), it needs to correctly configure the LLVM pass pipeline so that it includes the
     LoopCounterSanitizer pass.
  3. The LLVM pass pipeline needs to run our LoopCounterSanitizer (we don't
     need to worry about this task if the previous task is done correctly).
  4. The linker needs to link our Compiler-RT library to the target program.
312 Learning LLVM IR Instrumentation
Although this workflow looks a little scary, don't be overwhelmed by the prospective workload – Clang can actually do most of these tasks for you, as long as you provide sufficient information. In the rest of this section, we'll show you how to implement the tasks shown in the preceding diagram to fully integrate our LPCSan into the Clang compilation pipeline (the following tutorial works inside the llvm-project/clang folder). Let's get started:
  1. First, we must modify include/clang/Basic/Sanitizers.def to add our
     sanitizer:
         // Shadow Call Stack
         SANITIZER("shadow-call-stack", ShadowCallStack)
         // Loop Counter Sanitizer
         SANITIZER("loop-counter", LoopCounter)
      This effectively adds a new enum value, LoopCounter, to the SanitizerKind
      class.
      It turns out that the driver will parse the -fsanitize command-line option and
      automatically translate loop-counter into SanitizerKind::LoopCounter
      based on the information we provided in Sanitizers.def.
  2. Next, let's work on the driver part. Open include/clang/Driver/
     SanitizerArgs.h and add a new utility method, needsLpcsanRt, to the
     SanitizerArgs class. Here is the code:
         bool needsLsanRt() const {…}
         bool needsLpcsanRt() const {
           return Sanitizers.has(SanitizerKind::LoopCounter);
      The utility method we created here can be used by other places in the driver to
      check if our sanitizer needs a Compiler-RT component.
Developing a sanitizer 313
3. Now, let's navigate to the lib/Driver/ToolChains/CommonArgs.cpp file.
   Here, we're adding a few lines to the collectSanitizerRuntimes function.
   Here is the code:
      if (SanArgs.needsLsanRt() && SanArgs.linkRuntimes())
        StaticRuntimes.push_back("lsan");
      if (SanArgs.needsLpcsanRt() && SanArgs.linkRuntimes())
        StaticRuntimes.push_back("lpcsan");
The preceding snippet effectively makes the linker link the correct Compiler-RT library to the target binary. 4. The last change we will make to the driver is in lib/Driver/ ToolChains/Linux.cpp. Here, we add the following lines to the Linux::getSupportedSanitizers method:
      SanitizerMask Res = ToolChain::getSupportedSanitizers();
      Res |= SanitizerKind::LoopCounter;
The previous code is essentially telling the driver that we support the LPCSan in the current toolchain – the toolchain for Linux. Note that to simplify our example, we are only supporting the LPCSan in Linux. If you want to support this custom sanitizer in other platforms and architectures, modify the other toolchain implementations. Please refer to Chapter 8, Working with Compiler Flags and Toolchains, for more details if needed. 5. Finally, we are going to insert our LoopCounterSanitizer pass into the LLVM pass pipeline. Open lib/CodeGen/BackendUtil.cpp and add the following lines to the addSanitizers function: // `PB` has the type of `PassBuilder` PB.registerOptimizerLastEPCallback( [&](ModulePassManager &MPM, PassBuilder::OptimizationLevel Level) { if (LangOpts.Sanitize.has(SanitizerKind::LoopCounter))
314 Learning LLVM IR Instrumentation
         {
               auto FA
                =
         createFunctionToLoopPassAdaptor(LoopCounterSanitizer());
               MPM.addPass(
         createModuleToFunctionPassAdaptor(std::move(FA)));
           });
      The enclosing folder for this file, CodeGen, is a place where the Clang and LLVM
      libraries meet. Therefore, we will see several LLVM APIs appear in this place. There
      are primarily two tasks for this CodeGen component:
      a. Converting the Clang AST into its equivalent LLVM IR module
      b. Constructing an LLVM pass pipeline to optimize the IR and generate machine code
      The previous snippet was trying to customize the second task – that is, customizing
      the LLVM Pass pipeline. The specific function – addSanitizers – we are
      modifying here is responsible for putting sanitizer passes into the pass pipeline. To
      have a better understanding of this code, let's focus on two of its components:
      i. P
          assBuilder: This class provides predefined pass pipeline configurations
         for each optimization level – that is, the O0 ~ O3 notations (as well as Os and
         Oz for size optimization) we are familiar with. In addition to these predefined
         layouts, developers are free to customize the pipeline by leveraging the extension
         point (EP).
      An EP is a certain position in the (predefined) pass pipeline where you can insert
      new passes. Currently, PassBuilder supports several EPs, such as at the beginning
      of the pipeline, at the end of the pipeline, or at the end of the vectorization process,
      to name a few. An example of using EP can be found in the preceding code, where
      we used the PassBuilder::registerOptimizerLastEPCallback
      method and a lambda function to customize the EP located at the end of the Pass
      pipeline. The lambda function has two arguments: ModulePassManager – which
      represents the pass pipeline – and the current optimization level. Developers can use
      ModulePassManager::addPass to insert arbitrary LLVM passes into this EP.
      ii. M
           odulePassManager: This class represents a Pass pipeline – or, more
          specifically, the pipeline for Module. There are, of course, other PassManager
          classes for different IR units, such as FunctionPassManager for Function.
Developing a sanitizer 315
      In the preceding code, we were trying to use the ModulePassManager
      instance to insert our LoopCounterSanitizer pass whenever
      SanitizerKind::LoopCounter was one of the sanitizers that had been
      designated by the user. Since LoopCounterSanitizer is a loop pass
      rather than a module pass, we need to add some adaptors between the pass
      and PassManager. The createFunctionToLoopPassAdaptor and
      createModuleToFunctionPassAdaptor functions we were using here
      created a special instance that adapts a pass to a PassManager of a different IR unit.
      This is all the program logic that supports our LPCSan in the Clang compilation
      pipeline.
  6. Last but not least, we must make a small modification to the build system. Open the
     runtime/CMakeLists.txt file and change the following CMake variable:
         set(COMPILER_RT_RUNTIMES fuzzer asan builtins … lpcsan)
         foreach(runtime ${COMPILER_RT_RUNTIMES})
      The change we made to COMPILER_RT_RUNTIMES effectively imports our
      LPCSan Compiler-RT libraries into the build.
These are all the steps necessary to support the LPCSan in Clang. Now, we can finally use
the LPCSan in the same way we showed you at the beginning of this section:
$ clang -O1 -fsanitize=loop-counter input.c -o input
In this section, we learned how to create a sanitizer. A sanitizer is a useful tool for capturing runtime behaviors without modifying the original program code. The ability to create a sanitizer increases the flexibility for compiler developers to create custom diagnosing tools tailored for their own use cases. Developing a sanitizer requires comprehensive knowledge of Clang, LLVM, and Compiler-RT: creating a new LLVM pass, making a new Compiler-RT component, and customizing the compilation pipeline in Clang. You can use the content in this section, to reinforce what you've learned in previous chapters of this book. In the last section of this chapter, we are going to look at one more instrumentation technique: PGO.
316 Learning LLVM IR Instrumentation
Working with PGO In the previous section, we learned how a sanitizer assists developers in performing sanity checks with higher precision using data that is only available at runtime. We also learned how to create a custom sanitizer. In this section, we will follow up on the idea of leveraging runtime data. We are going to learn an alternative use for such information – using it for compiler optimization. PGO is a technique that uses statistics that have been collected during runtime to enable more aggressive compiler optimizations. The profile in its name refers to the runtime data that's been collected. To give you an idea of how such data enhances an optimization, let's assume we have the following C code:
  void foo(int N) {
    if (N > 100)
      bar();
    else
      zoo();
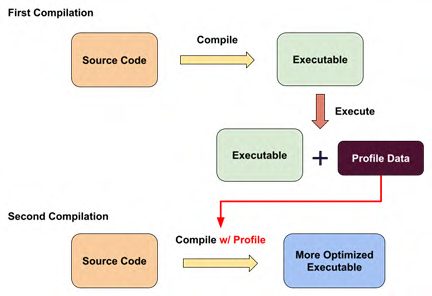
In this code, we have three functions: foo, bar, and zoo. The first function conditionally calls the latter two. When we try to optimize this code, the optimizer usually tries to inline callee functions into the caller. In this case, bar or zoo might be inlined into foo. However, if either bar or zoo has a large function body, inlining both might bloat the size of the final binary. Ideally, it will be great if we could inline only the one that executes the most frequently. Sadly, from a statistics point of view, we have no clue about which function has the highest execution frequency, because the foo function conditionally calls either of them based on a (non-constant) variable. With PGO, we can collect the execution frequencies of both bar and zoo at runtime and use the data to compile (and optimize) the same code again. The following diagram shows the high-level overview of this idea:
Working with PGO 317
Figure 12.5 – PGO workflow Here, the first compilation phase compiled and optimized the code normally. After we executed the compiled program (an arbitrary number of times), we were able to collect the profile data files. In the second compilation phase, we not only optimized the code, as we did previously, but also integrated the profile data into the optimizations to make them act more aggressively. There are primarily two ways for PGO to collect runtime profiling data: inserting instrumentation code or leveraging sampling data. Let's introduce both.
Introduction to instrumentation-based PGO Instrumentation-based PGO inserts instrumentation code into the target program during the first compilation phase. This code measures the execution frequency of the program constructions we're interested in – for example, basic blocks and functions – and writes the result in a file. This is similar to how a sanitizer works. Instrumentation-based PGO usually generates profiling data with higher precision. This is because the compiler can insert instrumentation code in a way that provides the greatest benefit for other optimizations. However, just like the sanitizer, instrumentation-based PGO changes the execution flow of the target program, which increases the risk of performance regression (for the binary that was generated from the first compilation phase).
318 Learning LLVM IR Instrumentation
Introduction to sampling-based PGO Sampling-based PGO uses external tools to collect profiling data. Developers use profilers such as perf or valgrind to diagnose performance issues. These tools usually leverage advanced system features or even hardware features to collect the runtime behavior of a program. For example, perf can give you insights into branch prediction and cache line misses. Since we are leveraging data from other tools, there is no need to modify the original code to collect profiles. Therefore, sampling-based PGO usually has an extremely low runtime overhead (usually, this is less than 1%). Also, we don't need to recompile the code for profiling purposes. However, profiling data that's generated in this way is usually less precise. It's also more difficult to map the profiling data back to the original code during the second compilation phase. In the rest of this section, we are going to focus on instrumentation-based PGO. We are going to learn how to leverage it with LLVM IR. Nevertheless, as we will see shortly, these two PGO strategies in LLVM share lots of common infrastructures, so the code is portable. Here is the list of topics we are going to cover:
• Working with profiling data • Learning about the APIs for accessing profiling data
The first topic will show us how to create and use instrumentation-based PGO profiles with Clang, as well as some of the tools that can help us inspect and modify profiling data. The second topic will give you more details on how to access profiling data using LLVM APIs. This is useful if you want to create your own PGO pass.
Working with profiling data In this section, we are going to learn how to use generate, inspect, and even modify instrumentation-based profiling data. Let's start with the following example:
  __attribute__((noinline))
  void foo(int x) {
    if (get_random() > 5)
      printf("Hello %d\n", x * 3);
  int main(int argc, char **argv) {
    for (int i = 0; i < argc + 10; ++i) {
      foo(i);
Working with PGO 319
return 0;
In the preceding code, get_random is a function that generates a random number from 1 to 10 with uniform distribution. In other words, the highlighted if statement in the foo function should have a 50% chance of being taken. In addition to the foo function, the trip count of the for loop within main depends on the number of command-line arguments there are. Now, let's try to build this code with instrumentation-based PGO. Here are the steps:
  1. The first thing we are going to do is generate an executable for PGO profiling. Here
     is the command:
          $ clang -O1 -fprofile-generate=pgo_prof.dir pgo.cpp -o
          pgo
       The -fprofile-generate option enables instrumentation-based PGO. The
       path that we added after this flag is the directory where profiling data will be stored.
  2. Next, we must run the pgo program with three command-line arguments:
          $ ./pgo `seq 1 3`
          Hello 0
          Hello 6
          Hello 36
          Hello 39
          $
       You might get a totally different output since there is only a 50% of chance of the
       string being printed.
       After this, the pgo_prof.dir folder should contain the
       default_<hash>_<n>.profraw file, as shown here:
          $ ls pgo_prof.dir
          default_10799426541722168222_0.profraw
The hash in the filename is a hash that's calculated based on your code.
320 Learning LLVM IR Instrumentation
  3. We cannot directly use the *.profraw file for our second compilation phase.
     Instead, we must convert it into another kind of binary form using the llvm-
     profdata tool. Here is the command:
$ llvm-profdata merge pgo_prof.dir/ -o pgo_prof.profdata
      llvm-profdata is a powerful tool for inspecting, converting, and merging
      profiling data files. We will look at it in more detail later. In the preceding
      command, we are merging and converting all the data files under pgo_prof.dir
      into a single *.profdata file.
  4. Finally, we can use the file we just merged for the second stage of compilation. Here
     is the command:
         $ clang -O1 -fprofile-use=pgo_prof.profdata pgo.cpp \
                 -emit-llvm -S -o pgo.after.ll
Here, the -fprofile-use option told clang to use the profiling data stored in pgo_ prof.profdata to optimize the code. We are going to look at the LLVM IR code after we've done this optimization. Open pgo.after.ll and navigate to the foo function. Here is a simplified version of foo:
  define void @foo(i32 %x) !prof !71 {
  entry:
    %call = call i32 @get_random()
    %cmp = icmp sgt i32 %call, 5
    br i1 %cmp, label %if.then, label %if.end, !prof !72
  if.then:
    %mul = mul nsw i32 %x, 3
In the preceding LLVM IR code, two places were different from the original IR; that is, the !prof tags that followed after both the function header and the branch instruction, which correspond to the if(get_random() > 5) code we saw earlier.
Working with PGO 321
In LLVM IR, we can attach metadata to different IR units to provide supplementary information. Metadata will show up as a tag starting with exclamation mark ('!') in the textual LLVM IR.!prof, !71, and !72 in the preceding code are metadata tags that represent the profiling data we collected. More specifically, if we have profiling data associated with an IR unit, it always starts with !prof, followed by another metadata tag that contains the required values. These metadata values are put at the very bottom of the IR file. If we navigate there, we will see the content of !71 and !72. Here is the code:
!71 = !{!"function_entry_count", i64 110} !72 = !{!"branch_weights", i32 57, i32 54}
These two metadata are tuples with two and three elements. !71, as suggested by its first element, represents the number of times the foo function was called (in this case, it was called 110 times). On the other hand,!72 marks the number of times each branch in the if(get_ random() > 5) statement was taken. In this case, the true branch was taken 57 times and the false branch was taken 54 times. We got these numbers because we were using uniform distribution for random number generation (namely, a ~50% chance for each branch). In the second part of this section, we will learn how to access these values for the sake of developing a more aggressive compiler optimization. Before we do that, though, let's take a deeper look at the profiling data file we just collected. The llvm-profdata tool we just used can not only help us convert the format of the profiling data, but also gives us a quick preview of its content. The following command prints out the summary for pgo_prof.profdata, including the profiling values that were collected from every function:
  $ llvm-profdata show –-all-functions –-counts pgo_prof.profdata
    foo:
      Hash: 0x0ae15a44542b0f02
      Counters: 2
      Block counts: [54, 57]
    main:
      Hash: 0x0209aa3e1d398548
      Counters: 2
      Block counts: [110, 1]
322 Learning LLVM IR Instrumentation
Instrumentation level: IR entry_first = 0 Functions shown: 9 Total functions: 9 Maximum function count: … Maximum internal block count: …
Here, we can see the profiling data entries for each function. Each entry has a list of numbers representing the execution frequency of all the enclosing basic blocks. Alternatively, you can inspect the same profiling data file by converting it into a textual file first. Here is the command:
$ llvm-profdata merge –-text pgo_prof.profdata -o pgo_prof. proftext $ cat pgo_prof.proftext # IR level Instrumentation Flag :ir foo # Func Hash: 784007059655560962 # Num Counters: # Counter Values:
The *.proftext file is in a human-readable textual format where all the profiling data is simply put in its own line. This textual representation can actually be converted back into the *.profdata format using a similar command. Here is an example:
$ llvm-profdata merge –-binary pgo_prof.proftext -o pgo_prof. profdata
Therefore, *.proftext is especially useful when you want to edit the profiling data manually. Before we dive into the APIs for PGO, there is one more concept we need to learn about: the instrumentation level.
Working with PGO 323
Understanding the instrumentation level So far, we've learned that instrumentation-based PGO can insert instrumentation code for collecting runtime profiling data. On top of this fact, the places where we insert this instrumentation code and its granularity also matter. This property is called the instrumentation level in instrumentation-based PGO. LLVM currently supports three different instrumentation levels. Here are descriptions of each:
   • IR: Instrumentation code is inserted based on LLVM IR. For example, the code
     to collect the number of taken branches is directly inserted before a branch
     instruction. The -fprofile-generate command-line option we introduced
     earlier will generate profiling data with this instrumentation level. For example, let's
     say we have the following C code:
         void foo(int x) {
           if (x > 10)
             puts("hello");
           else
             puts("world");
      The corresponding IR – without enabling instrumentation-based PGO – is shown here:
         define void @foo(i32 %0) {
           %4 = icmp sgt i32 %3, 10
           br i1 %4, label %5, label %7
         5:
             %6 = call i32 @puts(…"hello"…)
             br label %9
         7:
             %8 = call i32 @puts(…"world"…)
             br label %9
         9:
             ret void
324 Learning LLVM IR Instrumentation
      As we can see, there is a branch to either basic block; that is, %5 or %7. Now, let's
      generate the IR with instrumentation-based PGO enabled with the following
      command:
         $ clang -fprofile-generate -emit-llvm -S input.c
      This is the same command we used for the first PGO compilation phase in the
      Working with profiling data section, except that we are generating LLVM IR instead
      of an executable. The resulting IR is shown here:
         define void @foo(i32 %0) {
           %4 = icmp sgt i32 %3, 10
           br i1 %4, label %5, label %9
         5:
            %6 = load i64, i64* … @__profc_foo.0, align 8
           %7 = add i64 %6, 1
            store i64 %7, i64* … @__profc_foo.0, align 8
            %8 = call i32 @puts(…"hello"…)
            br label %13
         9:
            %10 = load i64, i64* … @__profc_foo.1, align 8
           %11 = add i64 %10, 1
            store i64 %11, i64* … @__profc_foo.1, align 8
            %12 = call i32 @puts(…"world"…)
            br label %13
         13:
           ret void
      In the preceding IR, the basic blocks in both branches have new code in them. More
      specifically, both increment the value in a global variable – either @__profc_
      foo.0 or @__profc_foo.1 – by one. The values in these two variables will
      eventually be exported as the profiling data for branches, representing the number
      of times each branch was taken.
Working with PGO 325
This instrumentation level provides decent precision but suffers from compiler changes. More specifically, if Clang changes the way it emits LLVM IR, the places where the instrumentation code will be inserted will also be different. This effectively means that for the same input code, the profiling data that's generated with an older version of LLVM might be incompatible with the profiling data that's generated with a newer LLVM. • AST: Instrumentation code is inserted based on an AST. For example, the code to collect the number of taken branches might be inserted as a new Stmt AST node inside an IfStmt (an AST node). With this method, the instrumentation code is barely affected by compiler changes and we can have a more stable profiling data format across different compiler versions. The downside of this instrumentation level is that it has less precision than the IR instrumentation level. You can adopt this instrumentation level by simply using the -fprofile-instrgenerate command-line option in place of -fprofile-generate when invoking clang for the first compilation. You don't need to change the command for the second compilation, though. • Context-sensitive: In the Working with profiling data section, we learned that we could collect information about the number of times a branch has been taken. However, with the IR instrumentation level, it's nearly impossible to tell which caller function leads to the most branch that has been taken the most. In other words, the conventional IR instrumentation level loses the calling context. The contextsensitive instrumentation level tries to address this problem by collecting the profiles again once the functions have been inlined, thus creating profiling data with higher precision. However, it's slightly cumbersome to use this feature in Clang – we need to compile the same code three times rather than twice. Here are the steps for using contextsensitive PGO: $ clang -fprofile-generate=first_prof foo.c -o foo_exe $ ./foo_exe … $ llvm-profdata merge first_prof -o first_prof.profdata
326 Learning LLVM IR Instrumentation
      First, generate some normal (IR instrumentation level) profiling data using what we
      learned in the Working with profiling data section:
         $ clang -fprofile-use=first_prof.profdata \
               -fcs-profile-generate=second_prof foo.c -o foo_exe2
         $ ./foo_exe2
         $ llvm-profdata merge first_prof.profdata second_prof \
                               -o combined_prof.profdata
      Then, run clang with two PGO command-line options, -fprofile-use and
      -fcs-profile-generate, with the path to the profiling file from the previous
      step and the prospective output path, respectively. When we use llvm-profdata
      to do the post-processing, we are merging all the profiling data files we have:
         $ clang -fprofile-use=combined_prof.profdata \
                 foo.c -o optimized_foo
Finally, feed the combined profiling file into Clang so that it can use this contextsensitive profiling data to get a more accurate portrait of the program's runtime behavior. Note that different instrumentation levels only affect the accuracy of the profiling data; they don't affect how we retrieve this data, which we are going to talk about in the next section. In the last part of this section, we are going to learn how to access this profiling data inside an LLVM pass via the APIs provided by LLVM.
Learning about the APIs for accessing profiling data In the previous section, we learned how to run the instrumentation-based PGO using Clang and view the profiling data file using llvm-profdata. In this section, we are going to learn how to access that data within an LLVM pass to help us develop our own PGO. Before we go into the development details, let's learn how to consume those profiling data files into opt, since it's easier to test individual LLVM pass using it. Here is a sample command:
  $ opt -pgo-test-profile-file=pgo_prof.profdata \
        --passes="pgo-instr-use,my-pass…" pgo.ll …
Working with PGO 327
There are two keys in the preceding command:
   • Use -pgo-test-profile-file to designate the profiling data file you want to
     put in.
   • The "pgo-instr-use" string represents the PGOInstrumentaitonUse pass,
     which reads (instrumentation-based) profiling files and annotates the data on an
     LLVM IR. However, it is not run by default, even in the predefined optimization
     levels (that is, O0 ~ O3, Os, and Oz). Without this pass being ahead in the Pass
     pipeline, we are unable to access any profiling data. Therefore, we need to explicitly
     add it to the optimization pipeline. The preceding sample command demonstrated
     how to run it before a custom LLVM pass, my-pass, in the pipeline. If you want to
     run it before any of the predefined optimization pipelines – for instance, O1 – you
     must specify the --passes="pgo-instr-use,default<O1>" command-line
     option.
Now, you might be wondering, what happens after the profiling data is read into opt? It turns out that the LLVM IR file that was generated by the second compilation phase – pgo.after.ll – has provided us with some answers to this question. In pgo.after.ll, we saw that some branches were decorated with metadata specifying the number of times they were taken. Similar metadata appeared in functions, which represented the total number of times those functions were called. More generally speaking, LLVM directly combines the profiling data – read from the file – with its associated IR constructions via metadata. The biggest advantage of this strategy is that we don't need to carry the raw profiling data throughout the entire optimization pipeline – the IR itself contains this profiling information. Now, the question becomes, how can we access metadata that's been attached to IR? LLVM's metadata can be attached to many kinds of IR units. Let's take a look at the most common one first: accessing metadata attached to an Instruction. The following code shows us how to read the profiling metadata –!prof !71, which we saw previously – that's attached to a branch instruction:
// `BB` has the type of `BasicBlock&` Instruction *BranchInst = BB.getTerminator(); MDNode *BrWeightMD = BranchInst->getMetadata(LLVMContext::MD_ prof);
328 Learning LLVM IR Instrumentation
In the preceding snippet, we are using BasicBlock::getTerminator to get the last instruction in a basic block, which is a branch instruction most of the time. Then, we tried to retrieve the profiling metadata with the MD_prof metadata. BrWeightMD is the result we are looking for. The type of BrWeightMD, MDNode, represents a single metadata node. Different MDNode instances can be composed together. More specifically, a MDNode instance can use other MDNode instances as its operands – similar to the Value and User instances we saw in Chapter 10, Processing LLVM IR. The compound MDNode can express more complex concepts. For example, in this case, each operand in BrWeightMD represents the number of times each branch was taken. Here is the code to access them:
  if (BrWeightMD->getNumOperands() > 2) {
    // Taken counts for true branch
    MDNode *TrueBranchMD = BrWeightMD->getOperand(1);
    // Taken counts for false branch
    MDNode *FalseBranchMD = BrWeightMD->getOperand(2);
As you can see, the taken counts are also expressed as MDNode.
        Operand indices for both branches
        Note that the data for both branches is placed at the operands starting from
        index 1 rather than index 0.
If we want to convert these branch MDNode instances into constants, we can leverage a small utility provided by the mdconst namespace. Here is an example:
  if (BrWeightMD->getNumOperands() > 2) {
    // Taken counts for true branch
    MDNode *TrueBranchMD = BrWeightMD->getOperand(1);
    ConstantInt *NumTrueBrTaken
      = mdconst::dyn_extract<ConstantInt>(TrueBranchMD);
The previous code unwrapped an MDNode instance and extracted the underlying ConstantInt instance.
Working with PGO 329
For Function, we can get the number of times it was called in an even easier way. Here is the code:
// `F` has the type of `Function&` Function::ProfileCount EntryCount = F.getEntryCount(); uint64_t EntryCountVal = EntryCount.getCount();
Function is using a slightly different way to present its called frequency. But retrieving the numerical profiling value is still pretty easy, as shown in the preceding snippet. It is worth noting that although we only focused on instrumentation-based PGO here, for sampling-based PGO, LLVM also uses the same programming interface to expose its data. In other words, even if you're using profiling data that's been collected from sampling tools with a different opt command, the profiling data will also be annotated on IR units and you can still access it using the aforementioned method. In fact, the tools and APIs we are going to introduce in the rest of this section are mostly profiling-data-source agnostic. So far, we have been dealing with real values that have been retrieved from the profiling data. However, these low-level values cannot help us go far in terms of developing a compiler optimization or program analysis algorithm – usually, we are more interested in high-level concepts such as "functions that are executed most frequently" or "branches that are least taken". To address these demands, LLVM builds several analyses on top of profiling data to deliver such high-level, structural information. In the next section, we are going to introduce some of these analyses and their usages in LLVM Pass.
Using profiling data analyses In this section, we are going to learn three analysis classes that can help us reason about the execution frequency of basic blocks and functions at runtime. They are as follows: • BranchProbabilityInfo • BlockFrequencyInfo • ProfileSummaryInfo
This list is ordered by their analyzing scope in the IR – from local to global. Let's start with the first two.
330 Learning LLVM IR Instrumentation
Using BranchProbabilityInfo and BlockFrequencyInfo In the previous section, we learned how to access the profiling metadata that's attached to each branch instruction – the branch weight. The analysis framework in LLVM provides you with an even easier way to access these values via the BranchProbabilityInfo class. Here is some example code showing how to use it in a (function) Pass:
  #include "llvm/Analysis/BranchProbabilityInfo.h"
  PreservedAnalyses run(Function &F, FunctionAnalysisManager
  &FAM) {
    BranchProbabilityInfo &BPI
      = FAM.getResult<BranchProbabilityAnalysis>(F);
    BasicBlock *Entry = F.getEntryBlock();
    BranchProbability BP = BPI.getEdgeProbability(Entry, 0);
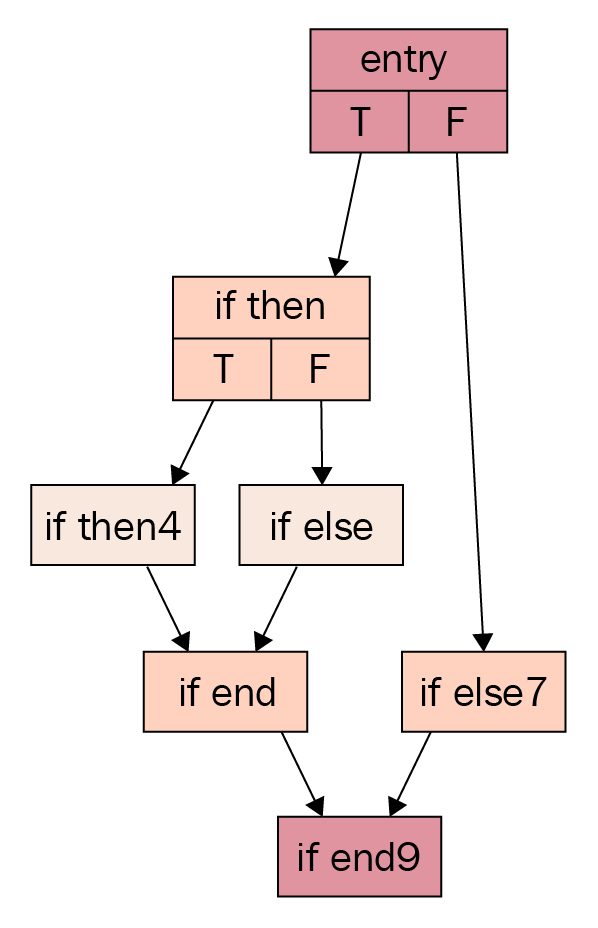
The previous code retrieved a BranchProbabilityInfo instance, which is the result of BranchProbabilityAnalysis, and tried to get the weight from the entry block to its first successor block. The returned value, a BranchProbability instance, gives you the branch's probability in the form of a percentage. You can use BranchProbability::getNumerator to retrieve the value (the "denominator" is 100 by default). The BranchProbability class also provides some handy utility methods for performing arithmetic between two branch probabilities or scaling the probability by a specific factor. Although we can easily tell which branch is more likely to be taken using BranchProbabilityInfo, without additional data, we can't tell the branch's probability (to be taken) in the whole function. For example, let's assume we have the following CFG:
Working with PGO 331
                            Figure 12.6 – CFG with nested branches
For the preceding diagram, we have profiling counter values for the following basic blocks:
• if.then4: 2 • if.else: 10 • if.else7: 20
If we only look at the branch weight metadata toward blocks if.then4 and if.else – that is, the true and false branches for if.then, respectively – we might come under the illusion that the if.else block has a ~83% chance of being taken. But the truth is, it only has a ~31% chance because the control flow has a higher probability to go into if.else7 before even entering the if.then region. Of course, in this case, we can do simple math to figure out the correct answer, but when the CFG is getting bigger and more complex, we might have a hard time doing this by ourselves. The BlockFrequencyInfo class provides a shortcut to this problem. It can tell us the frequency of each basic block to be taken under the context of its enclosing function. Here is an example of its usage in a Pass:
  #include "llvm/Analysis/BlockFrequencyInfo.h"
  PreservedAnalyses run(Function &F, FunctionAnalysisManager
  &FAM) {
    BlockFrequencyInfo &BFI
      = FAM.getResult<BlockFrequencyAnalysis>(F);
332 Learning LLVM IR Instrumentation
      for (BasicBlock *BB : F) {
        BlockFrequency BF = BFI.getBlockFreq(BB);
The previous code retrieved a BlockFrequencyInfo instance, which is the result of BlockFrequencyAnalysis, and tried to evaluate the block frequency of each basic block in the function. Similar to the BranchProbability class, BlockFrequency also provides nice utility methods to calculate with other BlockFrequency instances. But different from BranchProbability, the numeric value that's retrieved from BlockFrequency is not presented as a percentage. More specifically, BlockFrequency::getFrequency returns an integer that is the frequency relative to the entry block of the current function. In other words, to get a percentage-based frequency, we can use the following snippet:
// `BB` has the type of `BasicBlock*` // `Entry` has the type of `BasicBlock*` and represents entry // block BlockFrequency BBFreq = BFI.getBlockFreq(BB), EntryFreq = BFI.getBlockFreq(Entry); auto FreqInPercent = (BBFreq.getFrequency() / EntryFreq.getFrequency()) * 100;
The highlighted FreqInPercent is the block frequency of BB, expressed as a percentage. BlockFrequencyInfo calculates the frequency of a specific basic block under the context of a function – but what about the entire module? More specifically, if we bring a call graph into this situation, can we multiply the block frequency we just learned with the frequency of the enclosing function being called, in order to get the execution frequency in the global scope? Fortunately, LLVM has prepared a useful class to answer this question – ProfileSummaryInfo.
Using ProfileSummaryInfo The ProfileSummaryInfo class gives you a global view of all the profiling data in a Module. Here is an example of retrieving an instance of it inside a module Pass:
#include "llvm/Analysis/ProfileSummaryInfo.h" PreservedAnalyses run(Module &M, ModuleAnalysisManager &MAM) {
Working with PGO 333
      ProfileSummaryInfo &PSI = MAM.
      getResult<ProfileSummaryAnalysis>(M);
ProfileSummaryInfo provides a wide variety of functionalities. Let's take a look at three of its most interesting methods:
   • isFunctionEntryCold/Hot(Function*): These two methods compare
     the entry count of a Function – which effectively reflects the number of times a
     function was called –against that of other functions in the same module and tell us
     if the inquiry function is ranking high or low in this metric.
   • isHot/ColdBlock(BasicBlock*, BlockFrequencyInfo&): These
     two methods work similarly to the previous bullet one but compare the execution
     frequency of a BasicBlock against all the other blocks in the module.
   • isFunctionCold/HotInCallGraph(Function*,
     BlockFrequencyInfo&): These two methods combine the methods from the
     previous two bullet points they can tell you whether a function is considered hot
     or cold based on its entry count or the execution frequency of its enclosing basic
     blocks. This is useful when a function has a low entry count – that is, it was not
     called often – but contains a loop that has extremely a high basic block execution
     frequency. In this case, the isFunctionHotInCallGraph method can give us a
     more accurate assessment.
These APIs also have variants where you can designate the cutoff point as being "hot" or "cold." Please refer to the API documentation for more information. For a long time, the compiler was only able to analyze and optimize the source code with a static view. For dynamic factors inside a program – for instance, the branch taken count – compilers could only make an approximation. PGO opened an alternative path to provide extra information for compilers to peek into the target program's runtime behavior, for the sake of making less ambiguous and more aggressive decisions. In this section, we learned how to collect and use runtime profiling information – the key to PGO – with LLVM. We learned how to use the related infrastructure in LLVM to collect and generate such profiling data. We also learned about the programming interface we can use to access that data – as well as some high-level analyses built on top of it – to assist our development inside an LLVM Pass. With these abilities, LLVM developers can plug in this runtime information to further improve the quality and precision of their existing optimization Passes.
334 Learning LLVM IR Instrumentation
Summary In this chapter, we augmented the workspace of the compiler by processing the static source code and capturing the program's runtime behaviors. In the first part of this chapter, we learned how to use the infrastructure provided by LLVM to create a sanitizer – a technique that inserts instrumentation code into the target program for the sake of checking certain runtime properties. By using a sanitizer, software engineers can improve their development quality with ease and with high precision. In the second part of this chapter, we extended the usages of such runtime data to the domain of compiler optimization; PGO is a technique that uses dynamic information, such as the execution frequency of basic blocks or functions, to make more aggressive decisions for optimizing the code. Finally, we learned how to access such data with an LLVM Pass, which enables us to add PGO enhancement to existing optimizations. Congratulations, you've just finished the last chapter! Thank you so much for reading this book. Compiler development has never been an easy subject – if not an obscure one – in computer science. In the past decade, LLVM has significantly lowered the difficulties of this subject by providing robust yet flexible modules that fundamentally change how people think about compilers. A compiler is not just a single executable such as gcc or clang anymore – it is a collection of building blocks that provide developers with countless ways to create tools to deal with hard problems in the programming language field. However, with so many choices, I often became lost and confused when I was still a newbie to LLVM. There was documentation for every single API in this project, but I had no idea how to put them together. I wished there was a book that pointed in the general direction of each important component in LLVM, telling me what it is and how I can take advantage of it. And here it is, the book I wished I could have had at the beginning of my LLVM career – the book you just finished – come to life. I hope you won't stop your expedition of LLVM after finishing this book. To improve your skills even further and reinforce what you've learned from this book, I recommend you to check out the official document pages (https://llvm.org/docs) for content that complements this book. More importantly, I encourage you to participate in the LLVM community via either their mailing list (https://lists.llvm.org/cgi-bin/mailman/listinfo/llvmdev) or Discourse forum (https://llvm.discourse.group/), especially the first one – although a mailing list might sound old-school, there are many talented people there willing to answer your questions and provide useful learning resources. Last but not least, annual LLVM dev meetings (https://llvm.org/devmtg/), in both the United States and Europe, are some of the best events where you can learn new LLVM skills and chat face-to-face with people who literally built LLVM. I hope this book enlightened you on your path to mastering LLVM and helped you find joy in crafting compilers.